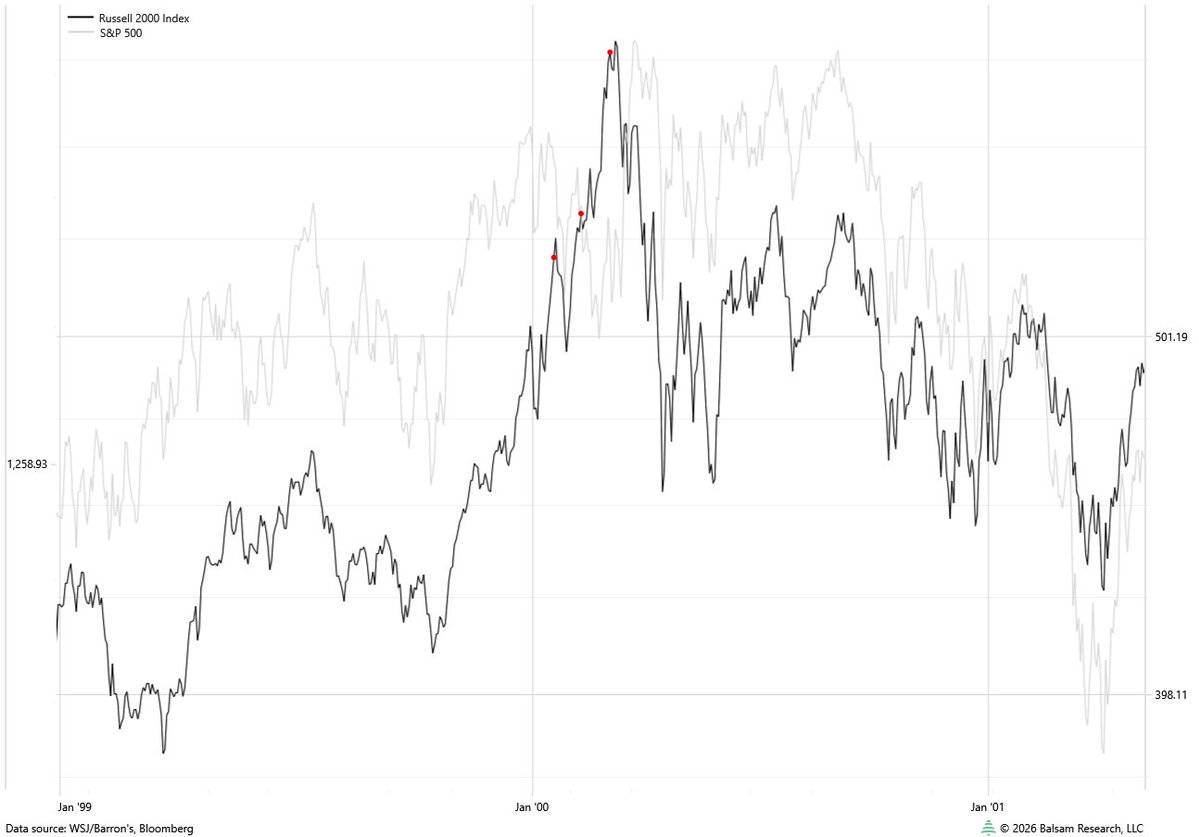
Was curious about the last time we've seen a significant new closing high in the Russell (up at least 50 bps) coupled with negative breadth (net NYSE breadth/issues traded <= -15%). Have to go all the way back to 3/6/2000, which coincidentally was the last time the SOX was up 100% in 56 trading days just like last week. Starting to see some similarities here . . . 🤔
@LindaRaschke This is not unrelated to your prior post on XBI. Biotech is the largest industry weight in the Russell. Many biotech names I've never heard of are super hot today. Helps explain why RTY is up so much on negative breadth.
Last week the PHLX Semiconductor Index $SOX closed up over 100% in 56 trading days from its March 30 closing low. That last time it had a 100% run over 56 trading days was 3/6/2000, just 4 days from a closing high that would hold for 17+ years. See my blog for more (link in bio).
@gfc4 Not having the Fed chair insist financial conditions are tight while people bid up fartcoin in his mug is a start. But talk is cheap. I wish him luck.
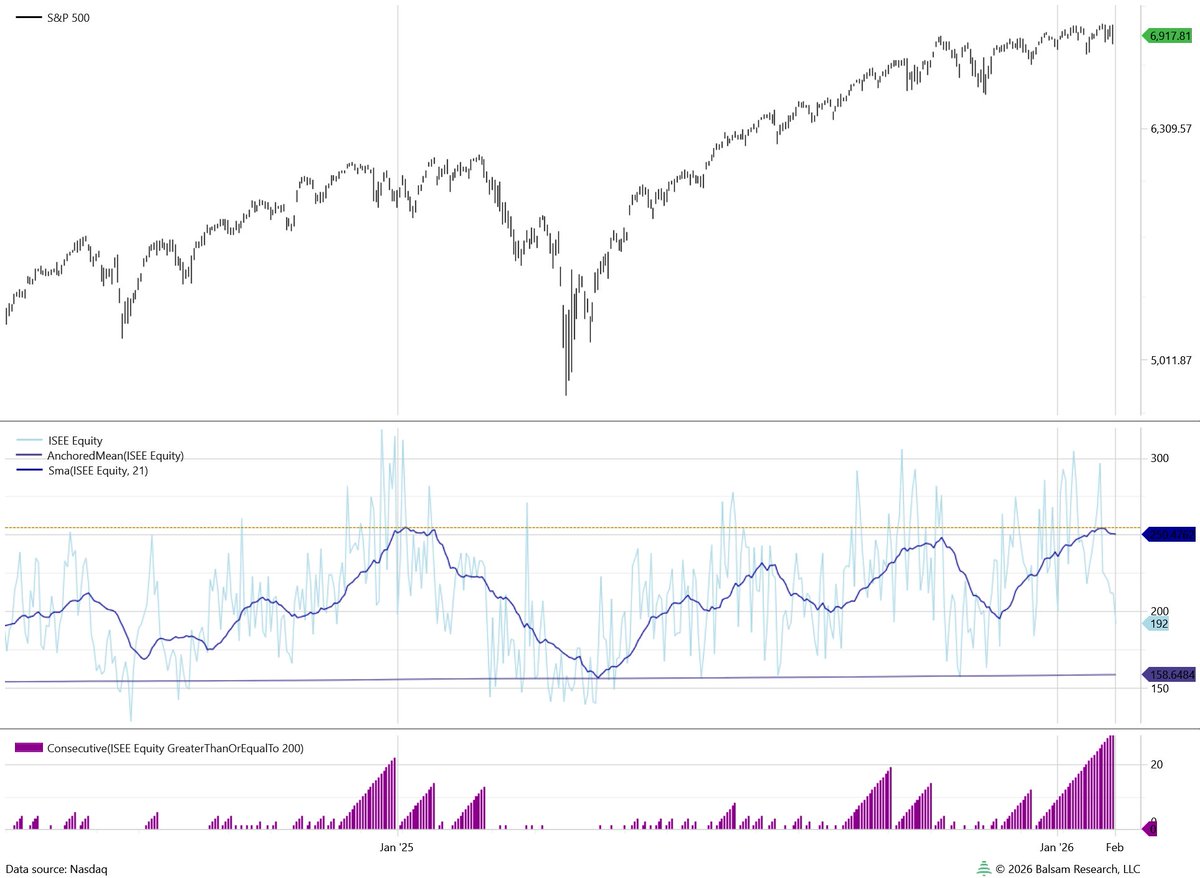
21 day moving avg of ISEE equity sentiment index just hit its highest level since inception over 20 years ago. Great time for Nasdaq to discontinue the series! @Chartfest1 It's still available via the API for the moment . . .
@Chartfest1 Nor could I. I'm not inclined to pay for it. The API link will probably quit working at some point in the future. Not sure what Nasdaq is trying to do with their site. Do people really need yet another landing page with a chart of the Nasdaq?
@Chartfest1 Would love to know as well. I watch the equity-only value. It went out at 262 (sourced via API). That will make the 28th consecutive day closing > 200. Only one to go to match previous streak right at the highs in early Feb. Horizontal line marks current value of the 21 day SMA.
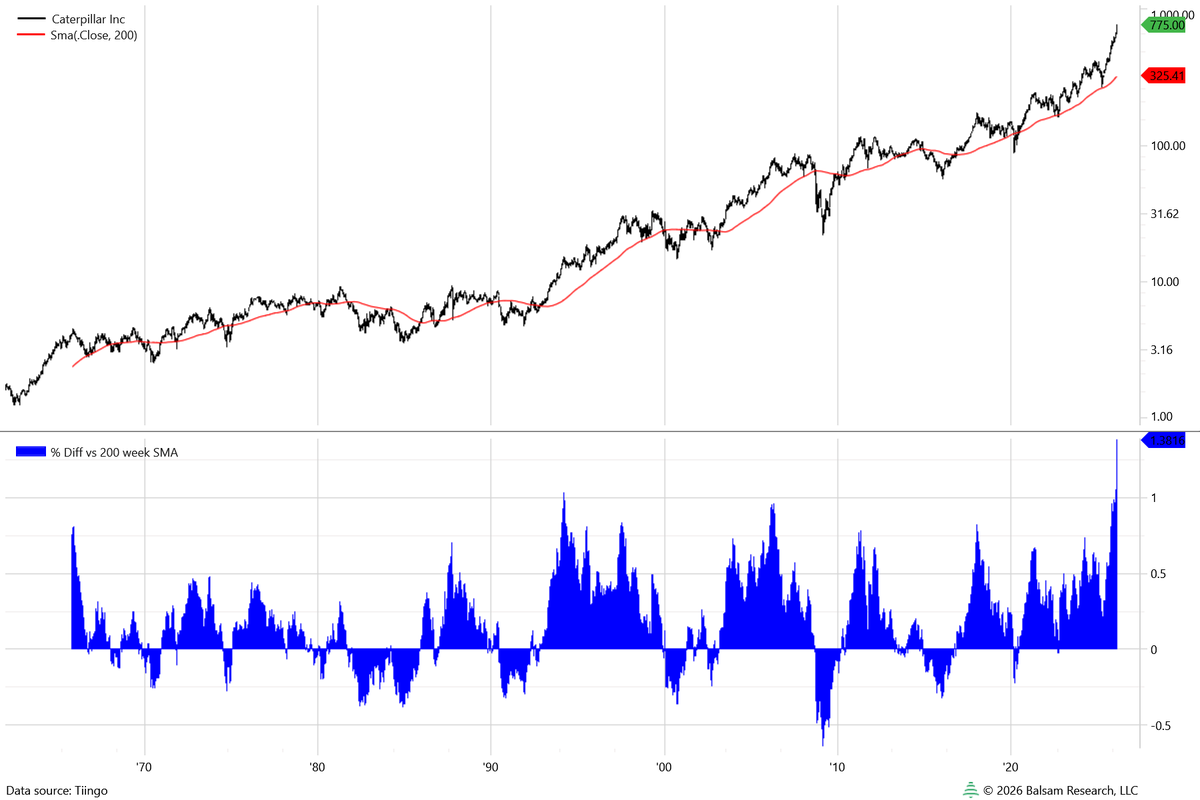
$CAT is 138% over its 200 week SMA, the most extreme stretch in over 60 years of data. Things are so extended it could get cut in half and still be above the average. CAT and Goldman combined are 21% of the price-weighted DJIA, so any reversal could have an outsized impact.
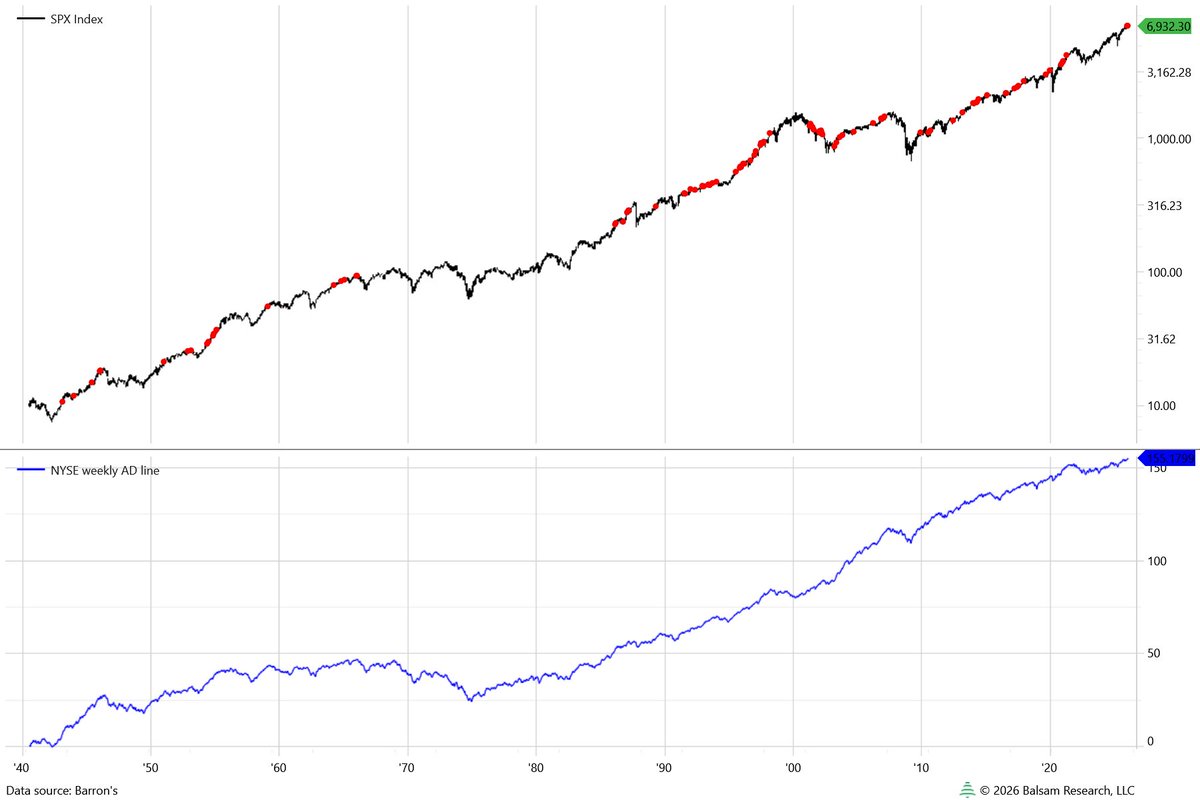
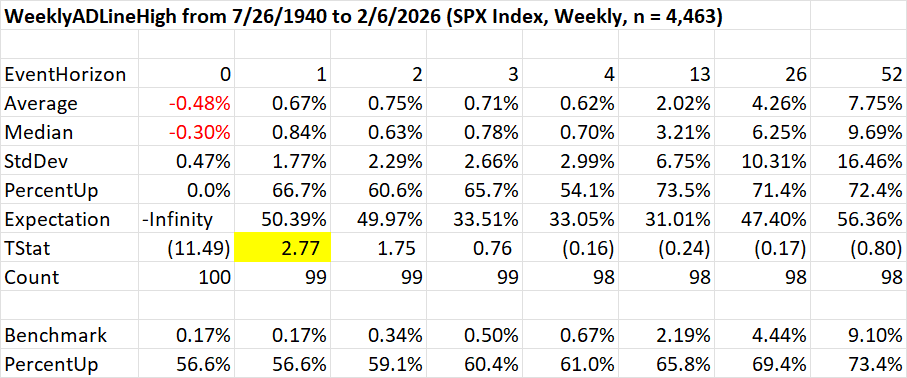
Weekly NYSE A/D line hit a record high despite the S&P closing down on the week. This setup has occurred 99 times prior in my data back to 1940 and has a decent upside bias for the following week.
Interesting to watch the strength in RSP today. Back in the 2000 TMT bubble, the equal-weighted S&P peaked over a full year after the cap-weighted S&P. Still didn't prevent it from having a 40% drawdown in the end.
@WalterDeemer Even as earnings increased, MCD suffered a 72% drawdown that took 10 years to recover. And that's on a total-return basis. (shout out to Tiingo for excellent clean historical data). MCD had an even worse drawdown in '99-'03. Something about history rhyming comes to mind . . .
Interesting to watch the strength in RSP today. Back in the 2000 TMT bubble, the equal-weighted S&P peaked over a full year after the cap-weighted S&P. Still didn't prevent it from having a 40% drawdown in the end.
Today the ISEE call/put ratio broke its record streak of 29 consecutive days closing >= 200 (i.e. 2 opening calls traded for every put). The 21-day SMA recently hit a level only exceeded by a single day in Jan '25. At least by this measure, options traders are all-in.