We take you to the east coast for this #GageGreatness matchup between the scenic Delaware River at Montague gage in New Jersey and the fascinating Conowingo Dam gage in Maryland. Learn more about each gage and vote!
Retirement is coming. I gave my last class lecture today. Gave my first one in 1988, 35 years ago. Today was General Ecology and the topic was Global Ecology. I chose to look at how the Earth has changed since I first started lecturing. A series of Tweets --
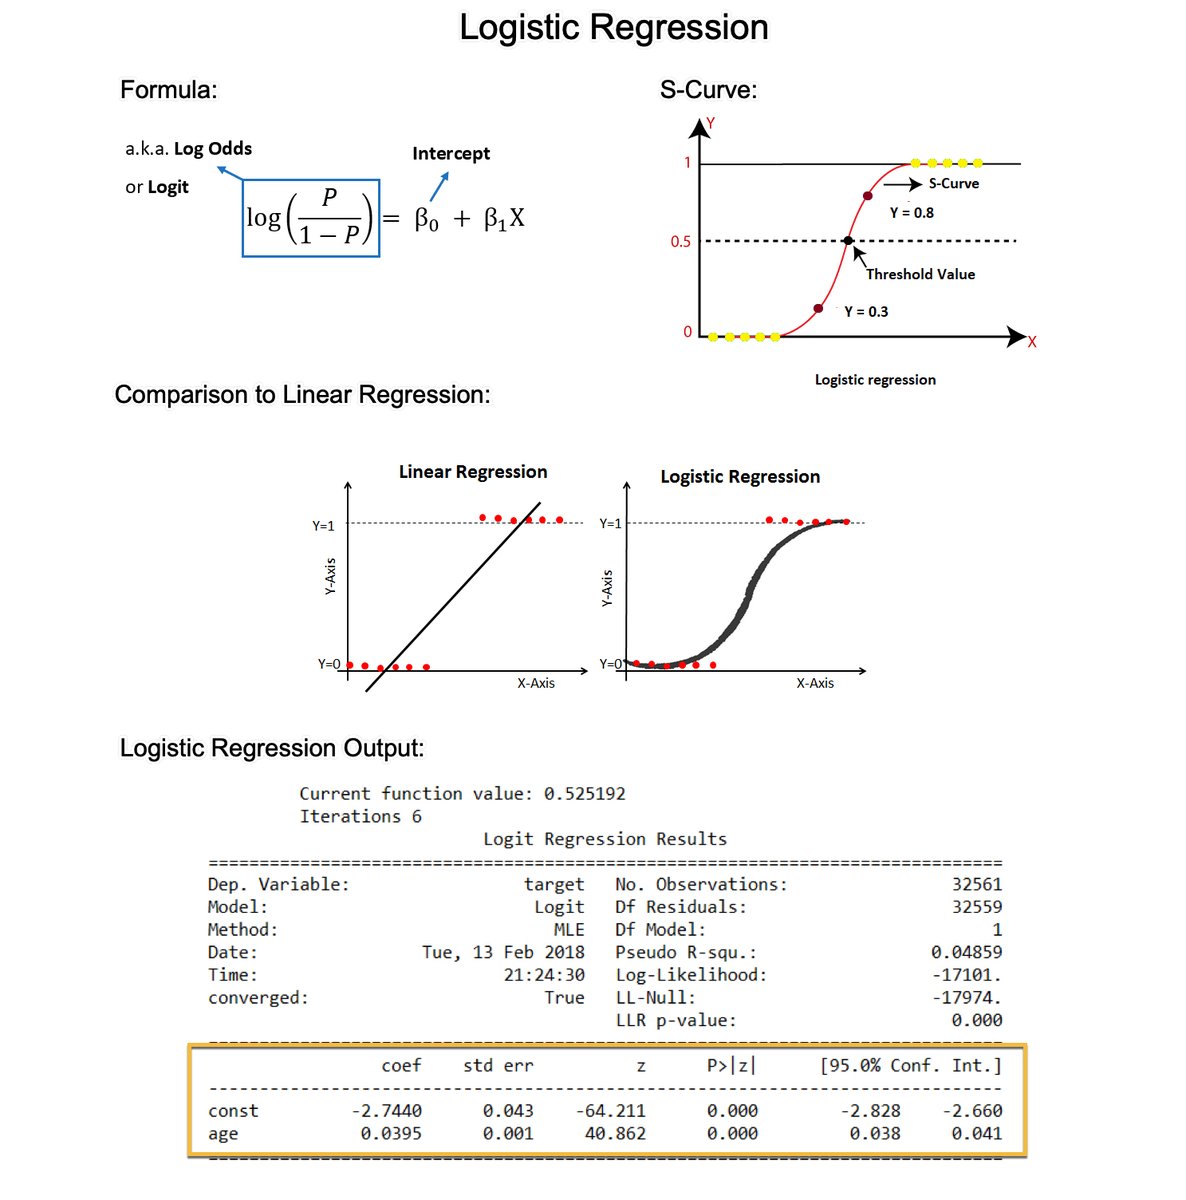
Logistic Regression is the most important foundational algorithm in Classification Modeling. In 2 minutes, I'll teach you what took me 2 months to learn. Let's dive in:
1. Logistic regression is a statistical method used for analyzing a dataset in which there are one or more independent variables that determine a binary outcome (in which there are only two possible outcomes). This is commonly called a binary classification problem.
2. The Logit (Log-Odds): The formula estimates the log-odds or logit. The right-hand side is the same as the form for linear regression. But the left-hand side is the logit function, which is the natural log of the odds ratio. The logit function is what distinguishes logistic regression from other types of regression.
3. The S-Curve: Logistic regression uses a sigmoid (or logistic) function to model the data. This function maps any real-valued number into a value between 0 and 1, making it suitable for a probability estimation. This is where the S-curve shape comes in.
4. Why not Linear Regression? The shape of the S-curve often fits the binary outcome better than a linear regression. Linear regression assumes the relationship is linear, which often does not hold for binary outcomes, where the relationship between the independent variables and the probability of the outcome is typically not linear but sigmoidal (S-shaped).
5. Coefficient Estimation: Like linear regression, logistic regression calculates coefficients for each independent variable. However, these coefficients are in the log-odds scale.
6. Coefficient Interpretation (Log-Odds to Odds): Exponentiating a coefficient converts it from log odds to odds. For example, if a coefficient is 0.5, the odds ratio is exp(0.5), which is approximately 1.65. This means that with a one-unit increase in the predictor, the odds of the outcome increase by a factor of 1.65.
7. Model evaluation: The evaluation metrics for linear regression (like R-squared) are not suitable for assessing the performance of a model in a classification context. For Logistic regression, I normally use classification-specific evaluation metrics like AUC, precision, recall, F1 score, ROC curve, etc.
===
Ready to learn Data Science for Business?
I put together a free on-demand workshop that covers the 10 skills that helped me make the transition to Data Scientist: https://t.co/LR39RJ5XKB
And if you'd like to speed it up, I have a live workshop next week where I'll share how to use ChatGPT for Data Science: https://t.co/EaMpKrJiqX
Learn how nature-based solutions 🌲 are used to protect our drinking water at our upcoming Walk in the Woods: Sam Michaels Park near Harpers Ferry, WV 🌄 on Oct. 21. The event is FREE and FUN!
@OurWVRivers@DEPWV
https://t.co/bzGPAIuDMT
Dive into "How To R: Visualizing Distributions" with insights from Nick Martin. A must-read for those passionate about data visualization! 📊 🔗: https://t.co/LMIZzq8rQL #dataviz#DataVisualization#Rprogramming#DataAnalysis
Antarctic Ice Mass Loss 2002-2023
In this period, #Antarctica shed approximately 150 gigatons of ice per year, causing global sea level to rise by 0.4 millimeters per year. Via NASA & JPL/Caltech. More info: https://t.co/WG6NVQK43c
This is a small step in the history of all packages ever published on the carefully-maintained Comprehensive R Archive Network (CRAN) but a huge leap forward for #rspatial. You can now call any of ~1000 geo algorithms in QGIS + plugins from #rstats. Amazing work Floris+ all 🚀
Mines | Dig & Fill ⛏️
Mesmerizing six years of coal pit mine evolution. Eastwards movement while it is filled. @CopernicusEU#Sentinel2 🛰️ 2016-2022
I’ve spent much of this year learning about car bloat, the process through which smaller vehicles are being replaced by increasingly massive SUVs and trucks.
What I’ve learned: Huge cars are terrible for society, often in ways that are hidden.
A summary 🧵
1/8 📌 Intro Both correlation and covariance provide insights into the relationship between two variables. While they might seem similar, there are key differences to note. Let's dive in! #DataScience#Statistics
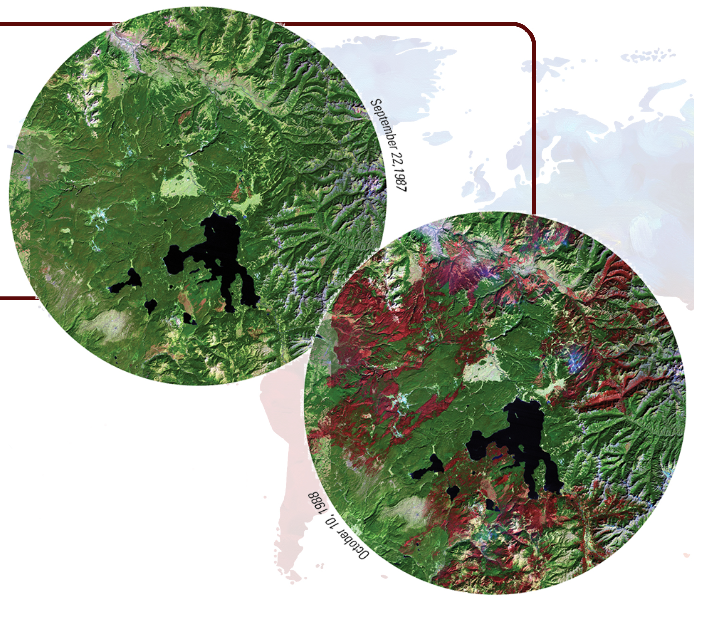
Want to test your skills at interpreting the changes seen in satellite imagery? Take the quiz! Can you get a 10 out of 10? Start here: https://t.co/n9OeQSWz4g
#Landsat 🛰️
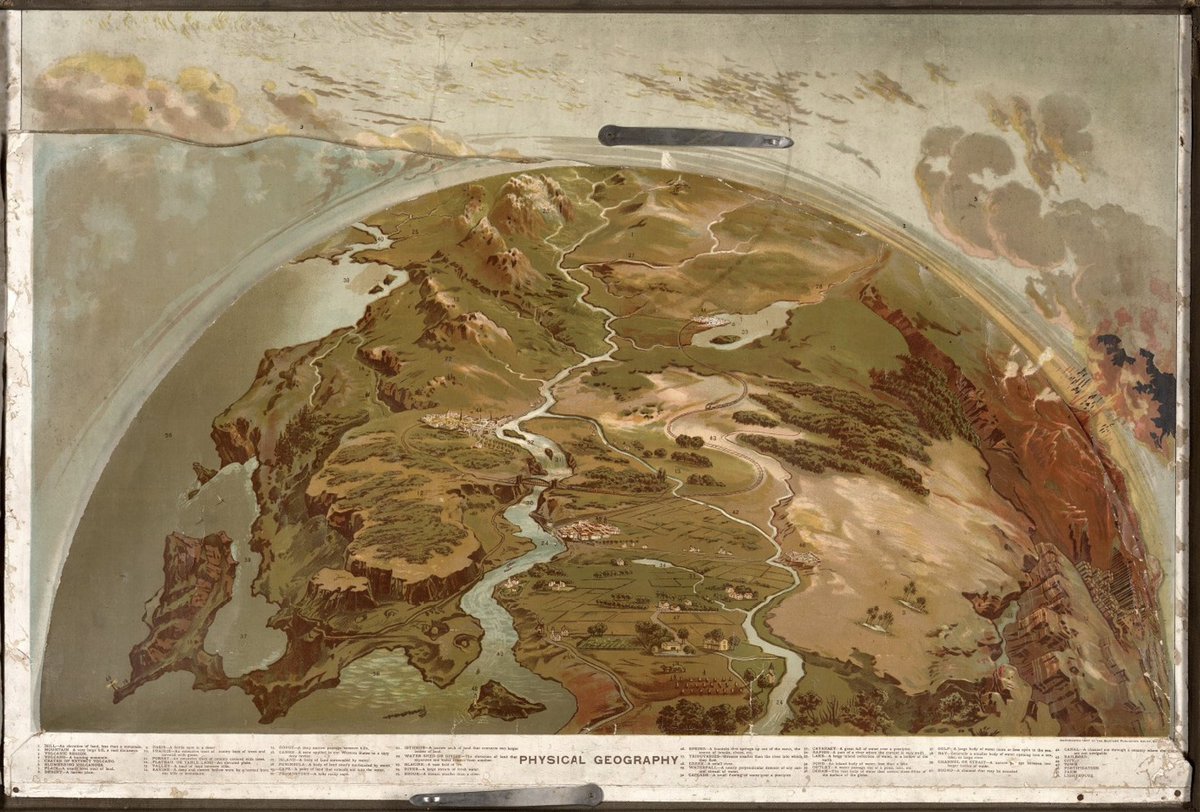
Levi Walter Yaggy (1842-1912) made brilliant maps and views for education in the 1887 Geographical Study and the 1893 Geographical Portfolio. 34 color plates of the world and universe inspired wonder. See all https://t.co/0D7PvpTOGF. See https://t.co/IACS645IUS for Yaggy's life.
Why do USGS scientists study streambanks and riparian zones?
Scientists can estimate the regularity and intensity of floods by looking at plant species as well as wood and sediment size transported by the stream.
#FieldPhotoFriday
Tomorrow: Join us online July 12 at 12 PM for our monthly seminar.
This month, John Harris of @UofMaryland will discuss his research on tributaries that enter the NE Branch Anacostia River channel above and below the active knickpoint.
https://t.co/7KLGRN1iKQ