Last piece of the puzzle for my post-doc research work on improving #lipid degradation in #anaerobicdigestion via #activatedcarbon supplementation is finally published! Been a long journey but a nice closing to my research.
Link to paper:
https://t.co/us0C3ggUY7
#B2VB week 6/#GameNightViz#outliers by @ReadySetData. Not the best graph selection cuz it was not possible to do categories/sorting. But I wanted to do a circular graph with spikes. Welcome feedback on this (wish I can do dynamic sorting)!
#Tableau link: https://t.co/w3Pv1ctu1X
Been obsessed with watching @BusinessInsider vids in youtube during my off week. This vid on how using #mushrooms as an alternative substrate for making bacon and styrofoam is amazing. Really #innovative and #sustainable way of working.
https://t.co/nOseSo5UCA
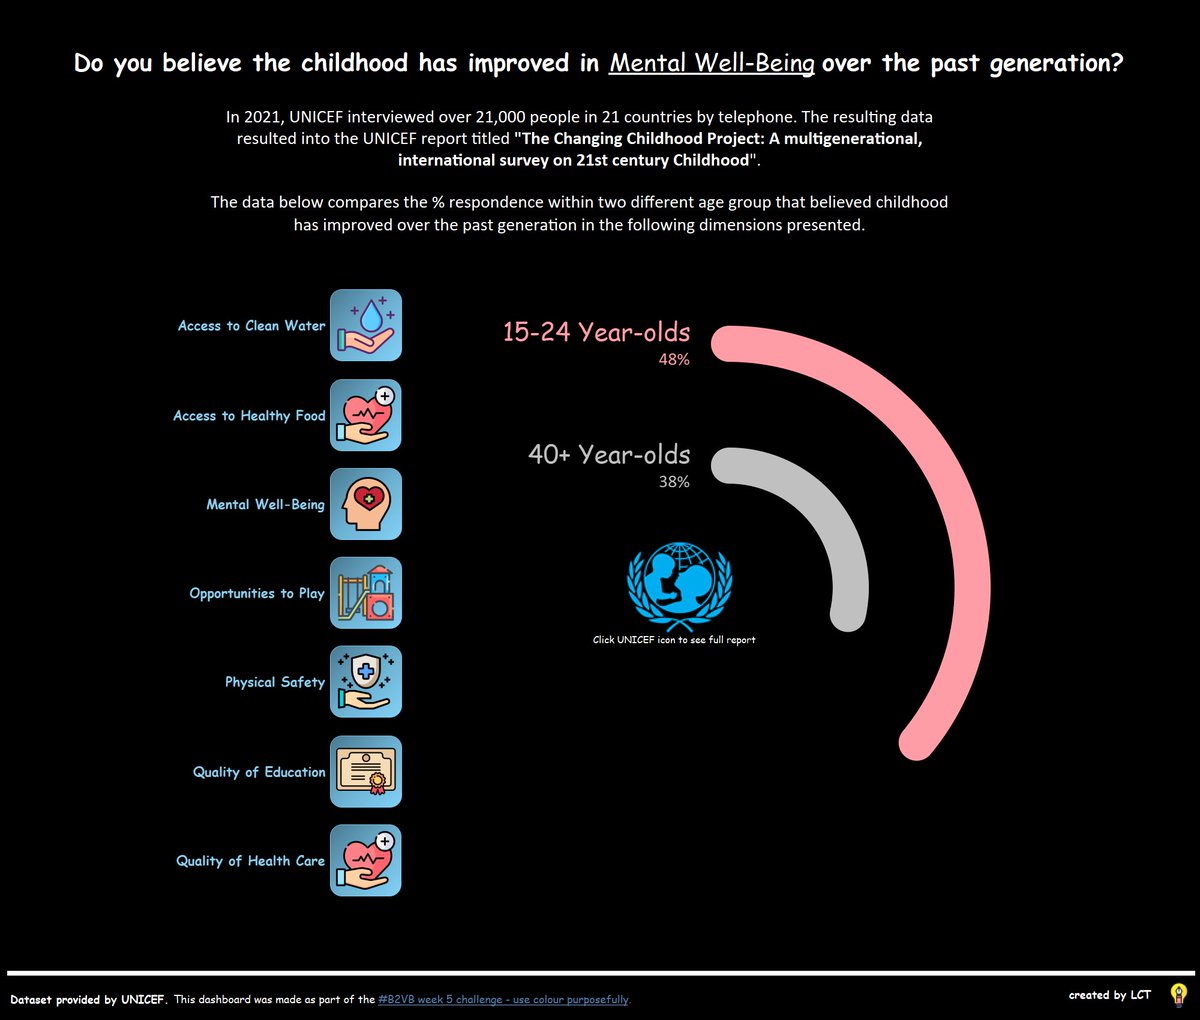
#B2VB week 5 @ReadySetData. I'm not very good with #colours so not sure if I did okay. Colour scheme inspiration taken from a friend's counsin's baby party. Full #Unicef report was very interesting. Might do a full dashboard at later.
Dashboard link:
https://t.co/tt5V1OM4pO
#B2VB week 4 challenge by @ReadySetData . Late submission due to covid but had enough energy to work on it. Gah! Had lots of issues with aggregates vs non-aggregate calculation! Definitely need to improve my level of detail understanding.
Link: https://t.co/yIPTnPNmJS
#Tableau
I'm really loving how the datasets are global! It is easier to see and compare trends and changes. I'm hoping for crime stats in one of the challenges or sales on board games/video games!
Getting a routine! Scheduled in #B2VB challenge every 2 weeks by @ReadySetData. For week 3, it is on the text table which challenges be design-wise. Use the ever-useful Min (0) technique to build the dashboard.
Link to the dashboard:
https://t.co/Dx1HE8Mbd8
#dashboard submission for #B2VB week 2 by @ReadySetData. Got overwhelmed with various half-baked ideas and then came across @sarahlovesdata's "Going Coal Free" #viz in #Tableau public and got inspired by it!
Interesting data trend when grouped differently.
https://t.co/AKADE6evML
Great to catch with Johns George ahead of next week's Tableau User Group Ireland.
Both his personal and professional stories are fascinating and we look forward to seeing his presentation on Wednesday 19th.
Find out all about our great guest speaker: https://t.co/dE3cHcy72x
Phew! Managed to finish my entry for @ReadySetData#B2VB week 1 challenge. Definitely took my mind off from feeling sick. Excited to learn how to utilize the dynamic reference band technique for this challenge (watched @VizWizBI vids to learn this).
https://t.co/yo3BaOgIlf
Amazing trailer on this #documentary! It's fitting too since my housemate literally has a puffer fish she named Puffer! XD
https://t.co/i0Kbh8ScAv
#MarineLife
Here we go, the blog you never knew you wanted. How to build a 'Decorate your own tree' viz.
https://t.co/lzknIjCrVd
Hopefully, it makes sense! 😃
#tableau#dataviz