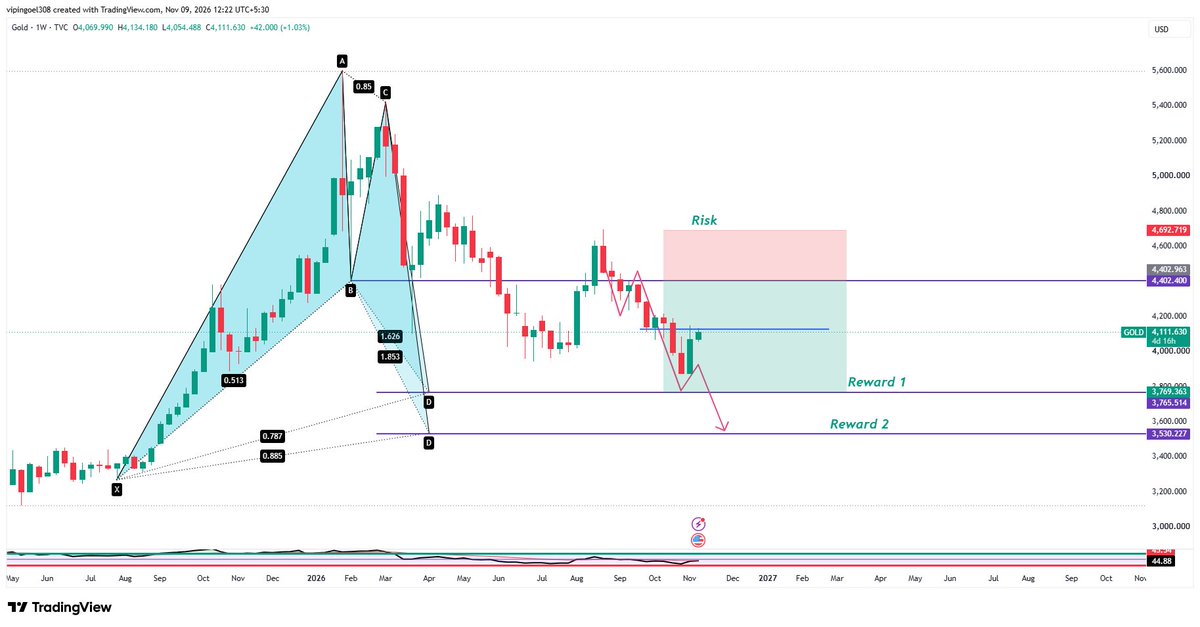
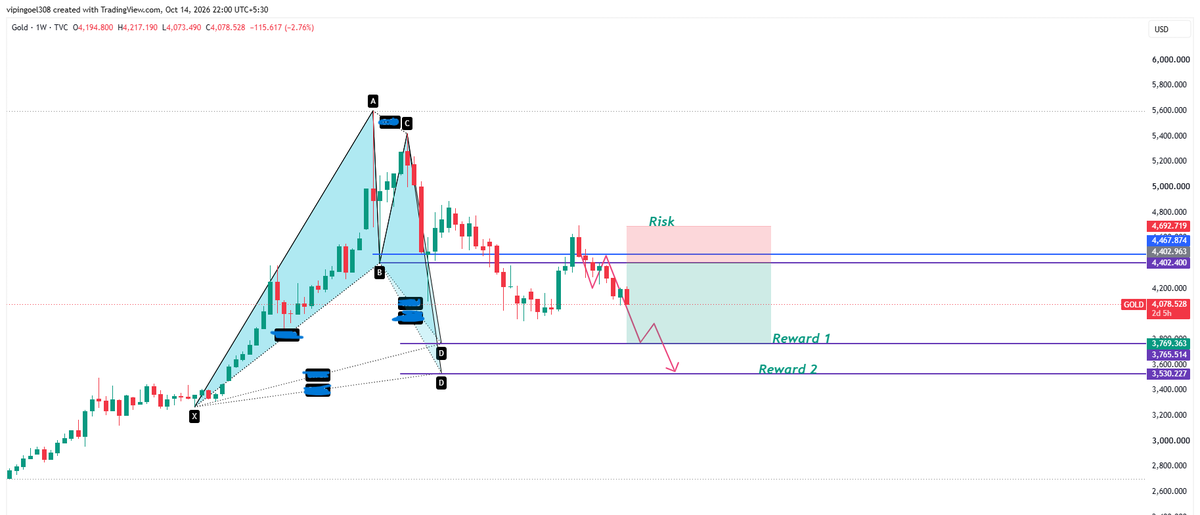
📉 GOLD (XAUUSD) Weekly Chart Update – Bearish Harmonic Structure in Play
👉Price action + the projected path on the chart suggest potential further downside if sellers maintain control below the recent breakdown levels.
👉A clean break under the current support zone opens the door toward the lower reward targets.
👉Join telegram for live updates, link in Bio.
#Gold #Silver #XAUUSD #GoldAnalysis #GoldTrading #TechnicalAnalysis #TradingView #HarmonicPattern #Fibonacci #PriceAction #Forex #Commodities #XAUUSDAnalysis #Bearish #Trading #ForexTrading
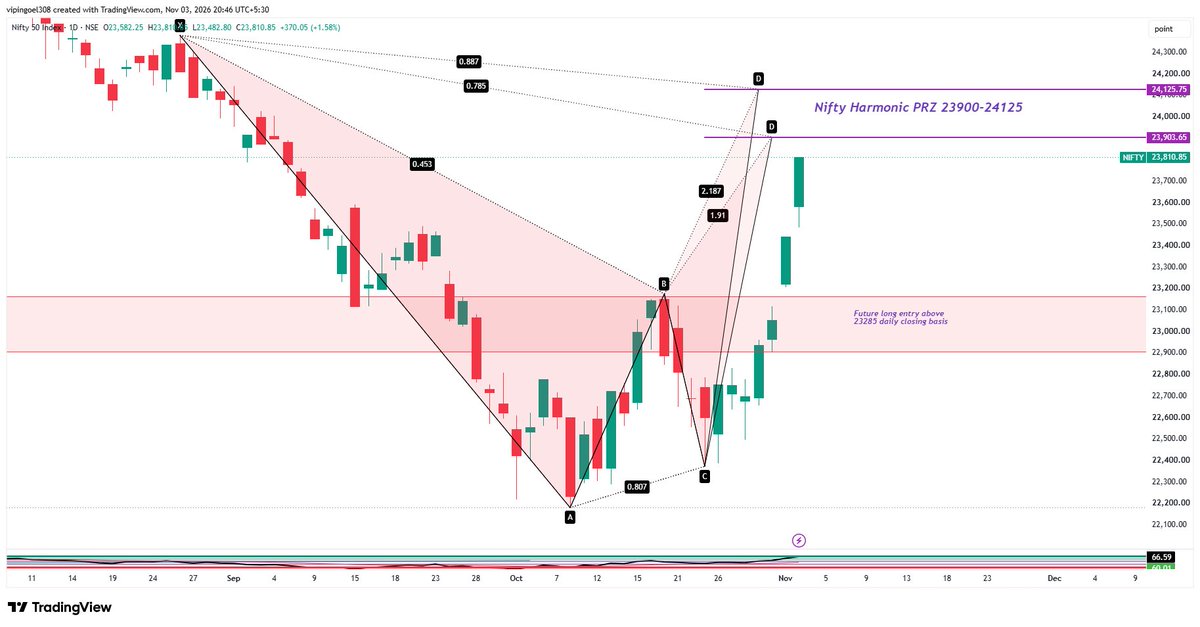
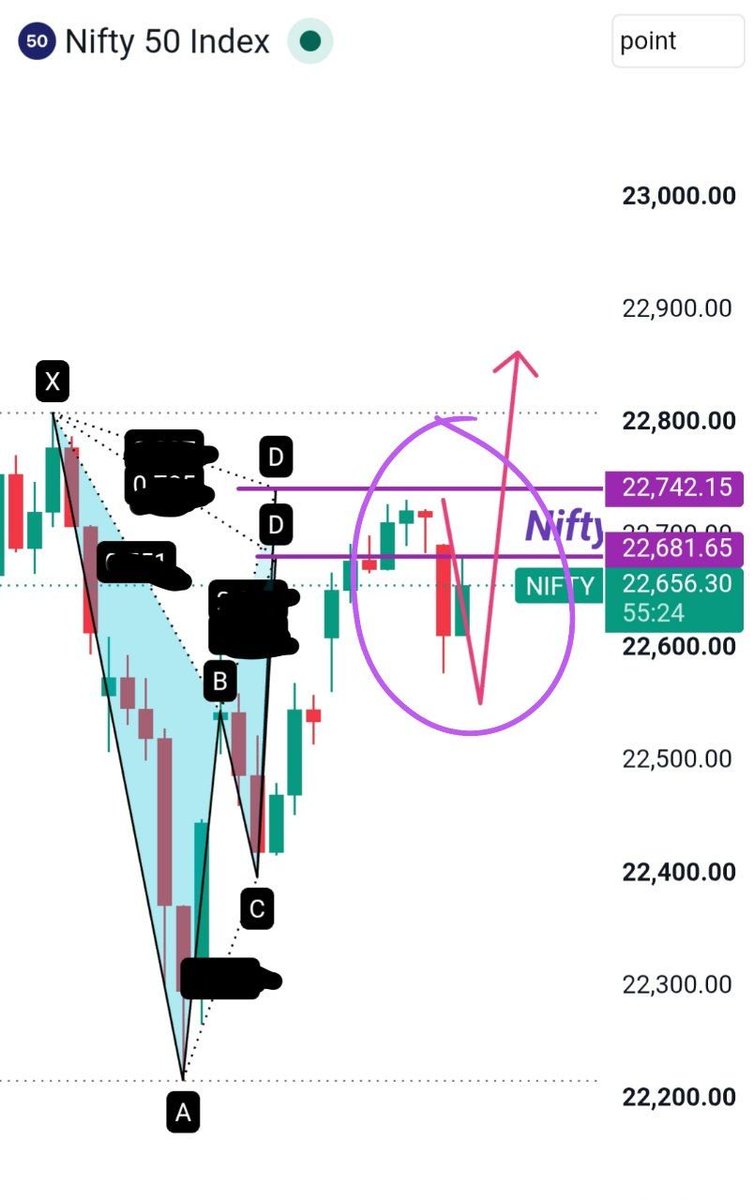
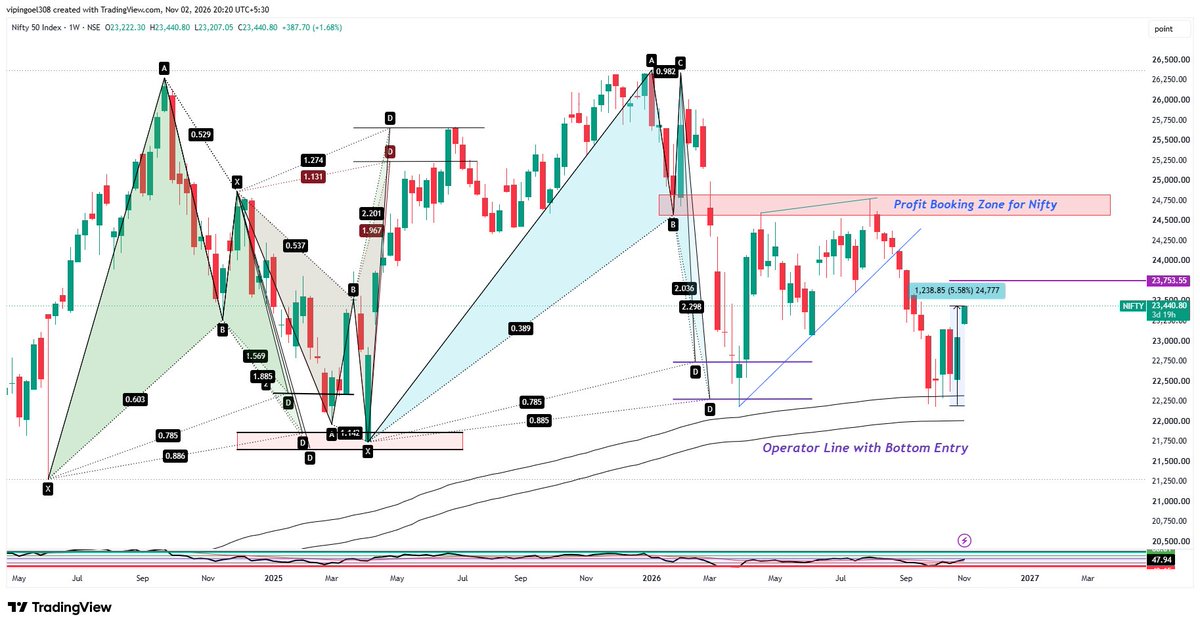
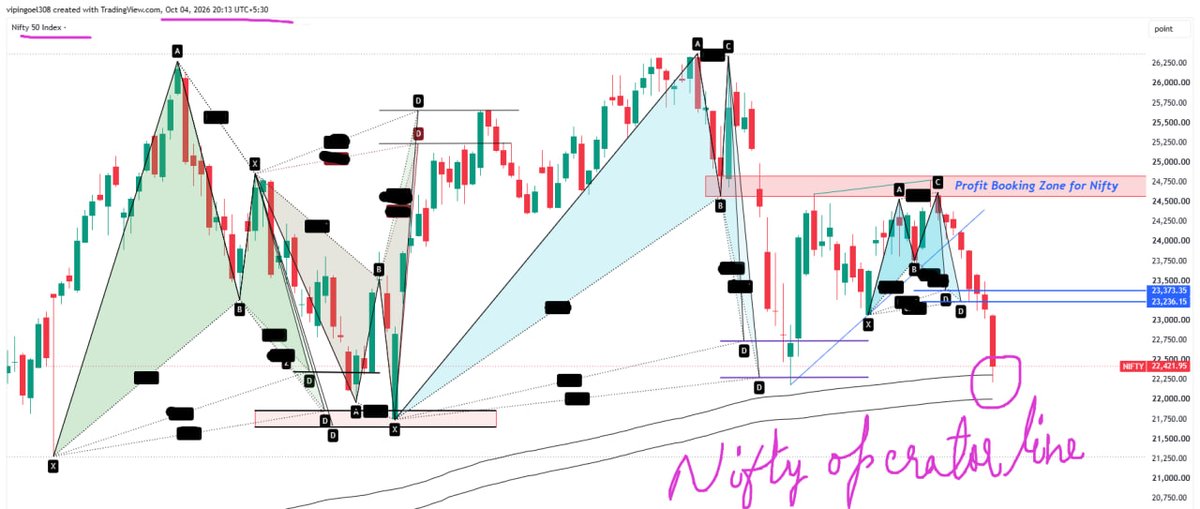
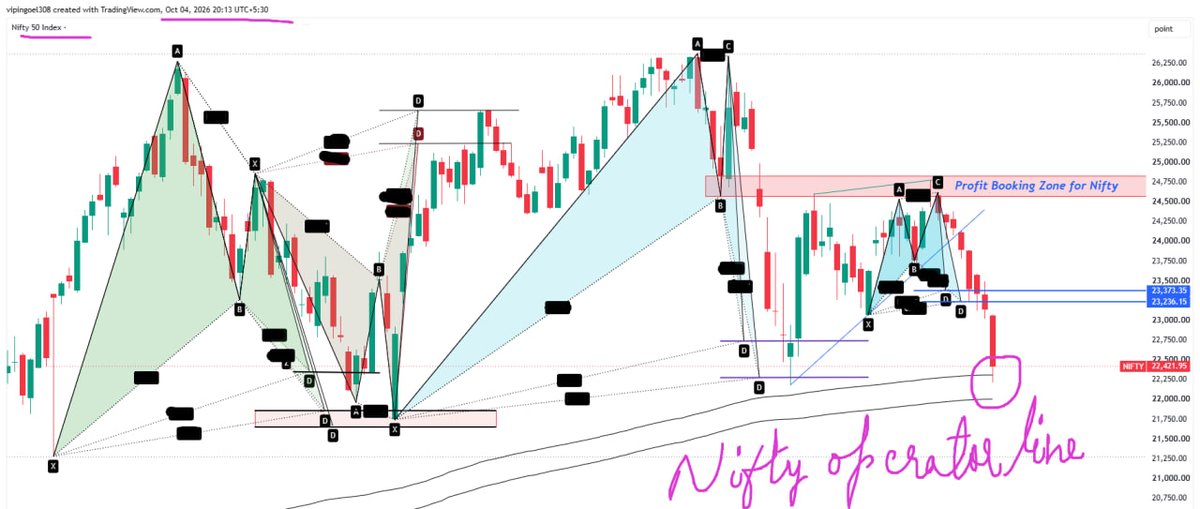
#Nifty is ready for 23900-24125 Harmonic PRZ range.
#Nifty50 has given the breakout on daily Timeframe and now is very near to our profit booking range.
👉nifty has given perfect bottom reversal from our given operator line.
👉Join telegram for live updates, link in Bio.
#Nifty #Nifty50 #BankNifty #StockMarket #trending #stocks
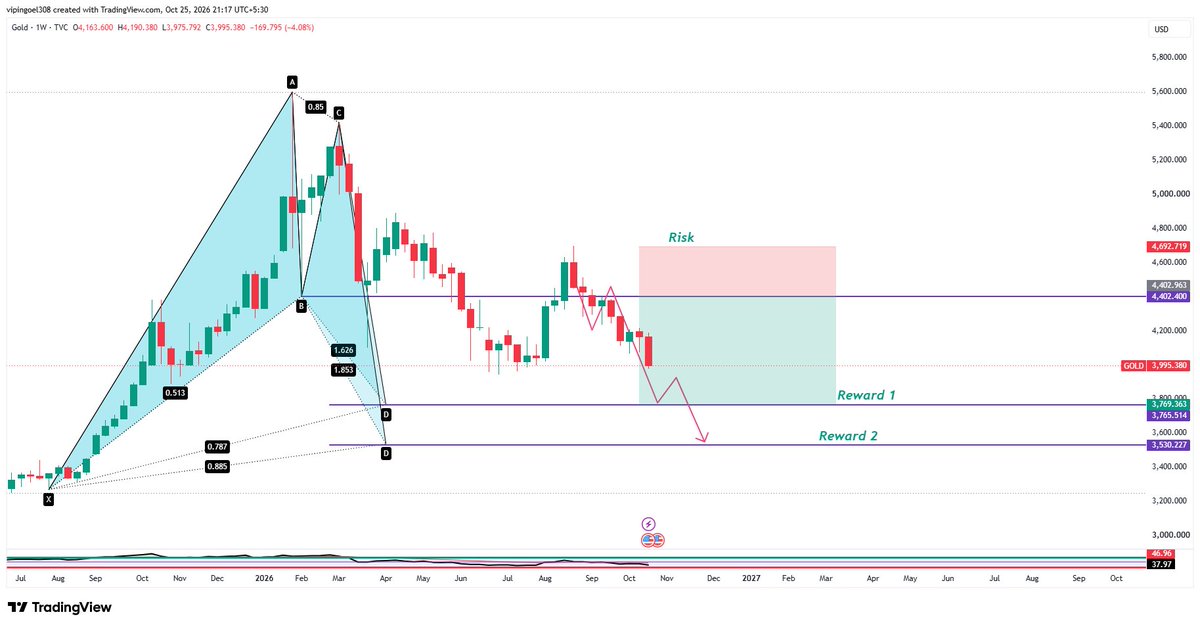
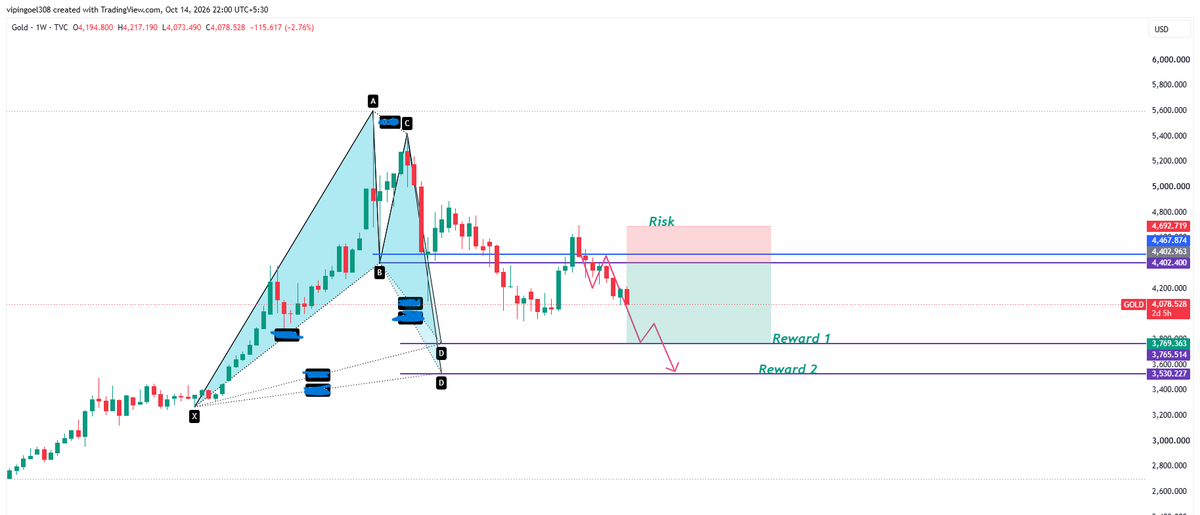
📉 GOLD (XAUUSD) Weekly Chart Update – Bearish Harmonic Structure in Play
📷Gold is trading near $3,995–$4,000 after a sharp weekly decline, sitting well below the 2026 highs (~$5,400 area).
📷Key Zones: Risk Zone (pink box): ~4,400–4,700+ (invalidation / rejection area) Reward 1: ~3,769 Reward 2: ~3,530
📷Price action + the projected path on the chart suggest potential further downside if sellers maintain control below the recent breakdown levels.
A clean break under the current support zone opens the door toward the lower reward targets.
📷Join telegram for live updates, link in Bio.
#Gold #Silver #XAUUSD #GoldAnalysis #GoldTrading #TechnicalAnalysis #TradingView #HarmonicPattern #Fibonacci #PriceAction #Forex #Commodities #XAUUSDAnalysis #Bearish #Trading #ForexTrading
📉 GOLD (XAUUSD) Weekly Chart Update – Bearish Harmonic Structure in Play
👉Gold is trading near $3,995–$4,000 after a sharp weekly decline, sitting well below the 2026 highs (~$5,400 area).
👉 The weekly chart shows a completed harmonic pattern (X-A-B-C-D structure) with key
👉Key Zones:
Risk Zone (pink box): ~4,400–4,700+ (invalidation / rejection area)
Reward 1: ~3,769
Reward 2: ~3,530
👉Price action + the projected path on the chart suggest potential further downside if sellers maintain control below the recent breakdown levels. A clean break under the current support zone opens the door toward the lower reward targets.
👉Bias: Bearish while price remains below the risk zone. Watch for confirmation on lower timeframes before entering.
Always manage risk — this is technical analysis, not financial advice. Trade what you see and protect your capital.
👉Join telegram for live updates, link in Bio.
#XAUUSD #Gold #GoldAnalysis #GoldTrading #TechnicalAnalysis #TradingView #HarmonicPattern #Fibonacci #PriceAction #Forex #Commodities #XAUUSDAnalysis #Bearish #Trading #ForexTrading
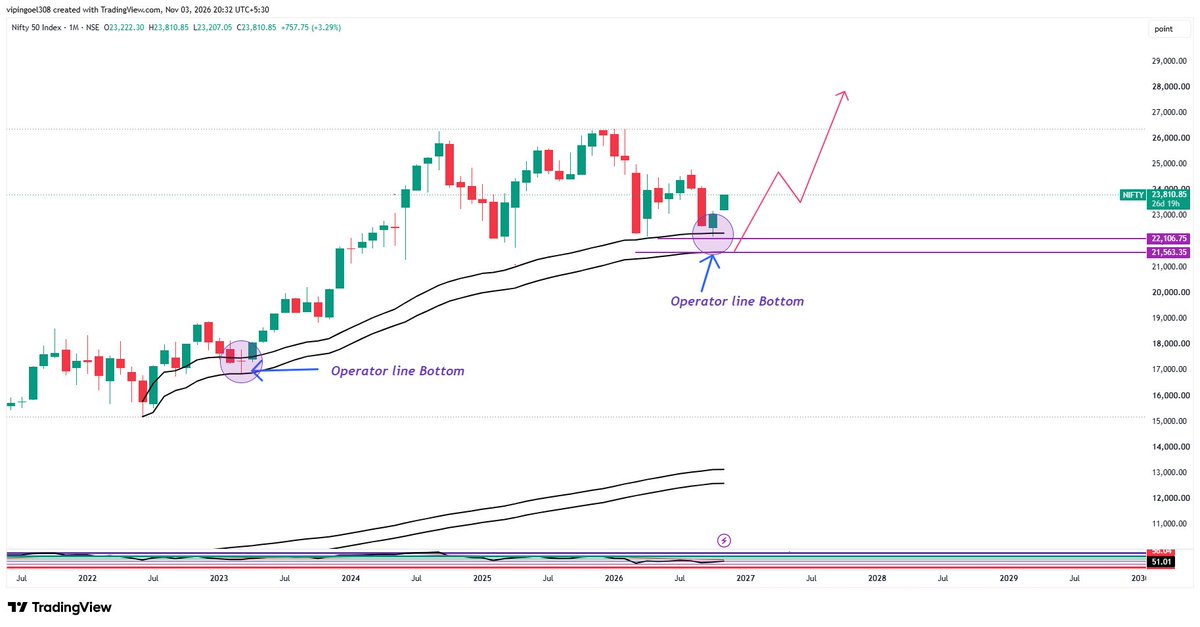
📈 Nifty 50 Monthly Chart | Long-Term Structure Intact
👉Price is consolidating near 22,600 after the recent move.
👉The chart highlights two clear "Operator Line Bottom" supports (circled zones) — one from 2023 and the current one around 21,500–22,100.
👉A strong upward projection is drawn from the current base, targeting the 28,000 zone into 2027–28.
👉 Horizontal levels marked at 22,106 and 21,563 remain key for the structure.
👉Join telegram for live updates, link in Bio.
#Nifty50 #Nifty #NiftyBank #IndianStockMarket #NSE #TechnicalAnalysis #StockMarket #TradingView #MarketOutlook #BullishStructure #LongTermInvesting #MONDAY
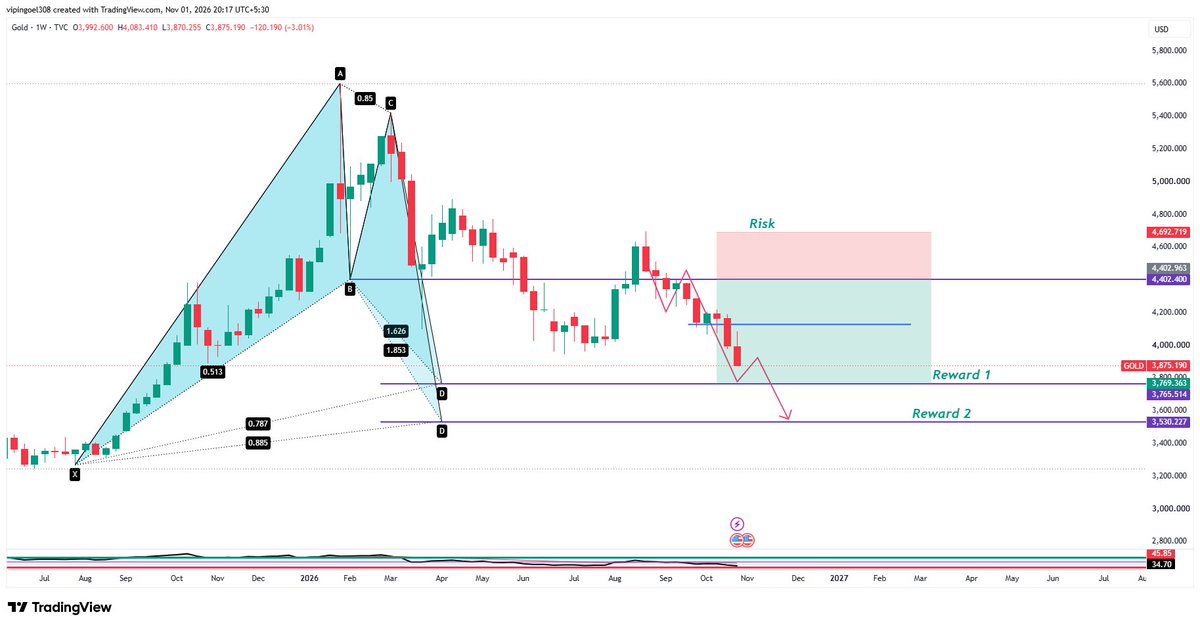
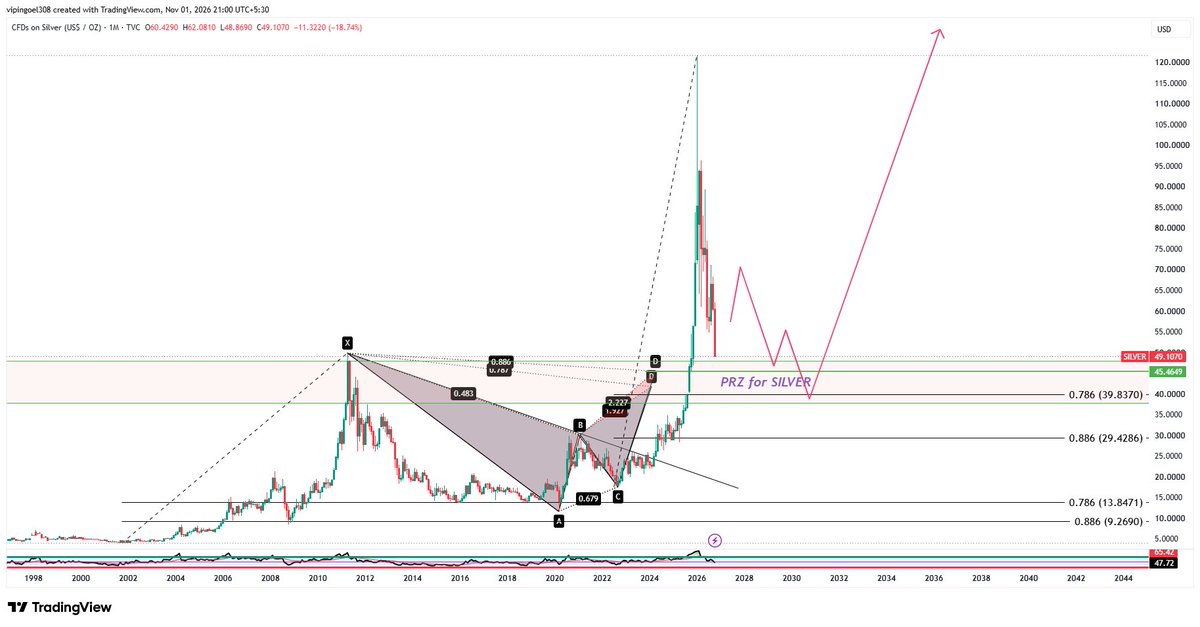
#Gold is dancing to our Harmonic tunes.
👉Gold top we have caught, and bottom has already given in advance i.e. 3770-3530.
👉Join telegram for live updates, link in Bio.
#gold#silver#xauusd#crash#commodity
👉Gold (XAUUSD) — Long-Term Breakout Structure IntactSpot gold is holding near $4,194–$4,195 after Friday’s strong rebound off the mid-week lows.
👉The monthly chart shows a clean multi-year accumulation and breakout structure, with price now well above key Fibonacci retracement zones (0.5 at ~$3,608 and 0.618 at ~$3,138).
👉The larger technical picture remains constructive — volume profile and price action continue to support the broader bullish thesis toward higher targets over the coming years.
👉Near-term watch: Hold above ~$4,160–$4,180 for continuation
👉Next resistance cluster ~$4,220–$4,230
👉Deeper support remains the $4,060–$4,100 zone from this week’s lows
👉Macro backdrop (softer oil, yields pulling back from extremes) helped the Friday bounce, while Fed rate-hike expectations still linger.
👉The long-term chart continues to favor higher prices on the multi-year horizon.
👉Join telegram for live updates, link in Bio.
#Gold #XAUUSD #GOLD #GoldPrice #PreciousMetals #XAU #GoldTrading #Trading #Forex #TechnicalAnalysis #TradingView #Commodities #SafeHaven #Bullion #MarketUpdate
#trending #HappyNavratri
👉GOLD UPDATE | Head & Shoulders confirmed
👉XAUUSD has broken and closed below the neckline near 4,313 after printing a clear
Left Shoulder – Head – Right Shoulder structure.
💸Price is now trading around 4,101, well under the broken neckline.
As long as gold stays below the 4,313–4,400 zone, the bearish pattern remains active.
👉Key levels from the chart:
• Broken neckline / invalidation zone: 4,313 – 4,400
• Risk area (failed breakdown): 4,467 – 4,692 • Current price: ~4,101
• Downside objective 1: 3,789
• Downside objective 2: 3,530
👉Structure favors sellers while price holds under the neckline. A reclaim and hold above 4,400 would weaken the setup. Until then, rallies into the broken neckline are the zones to watch for continuation lower.
👉Join telegram for live updates, link in Bio.
#XAUUSD #Gold #GoldTrading #Forex #ForexTrading #PriceAction #TechnicalAnalysis #HeadAndShoulders #XAU #Trading #GoldPrice #MarketAnalysis
👉Gold (XAUUSD) — Long-Term Breakout Structure IntactSpot gold is holding near $4,194–$4,195 after Friday’s strong rebound off the mid-week lows.
👉The monthly chart shows a clean multi-year accumulation and breakout structure, with price now well above key Fibonacci retracement zones (0.5 at ~$3,608 and 0.618 at ~$3,138).
👉The larger technical picture remains constructive — volume profile and price action continue to support the broader bullish thesis toward higher targets over the coming years.
👉Near-term watch: Hold above ~$4,160–$4,180 for continuation
👉Next resistance cluster ~$4,220–$4,230
👉Deeper support remains the $4,060–$4,100 zone from this week’s lows
👉Macro backdrop (softer oil, yields pulling back from extremes) helped the Friday bounce, while Fed rate-hike expectations still linger.
👉The long-term chart continues to favor higher prices on the multi-year horizon.
👉Join telegram for live updates, link in Bio.
#Gold #XAUUSD #GOLD #GoldPrice #PreciousMetals #XAU #GoldTrading #Trading #Forex #TechnicalAnalysis #TradingView #Commodities #SafeHaven #Bullion #MarketUpdate
#trending #HappyNavratri
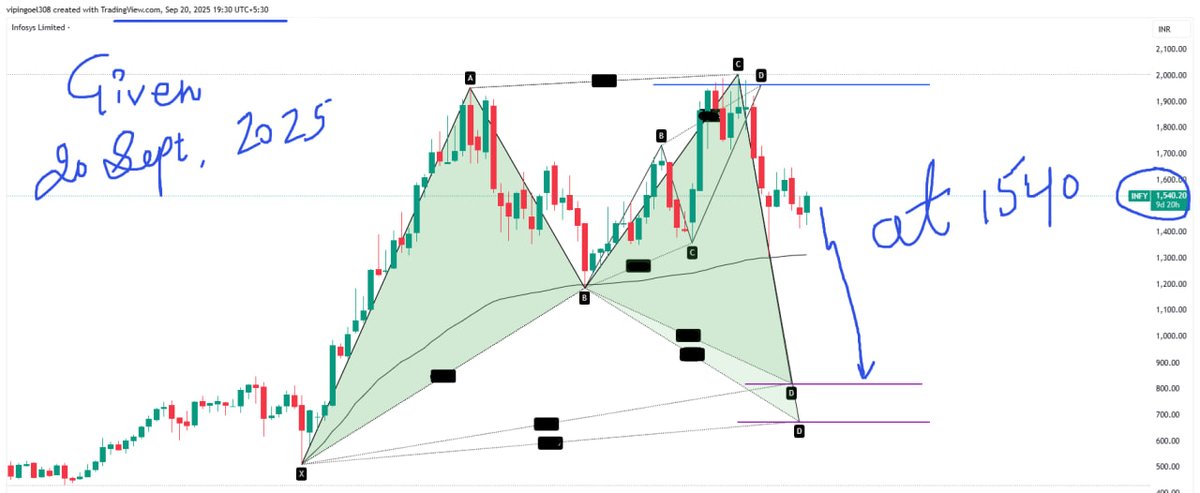
🚨 $INFY INFOSYS Chart Update | Oct 2026
👉 Infosys is going towards our downside Harmonic PRZ From ₹1,540 (20 Sept 2025) → ₹1,023 now.
👉The pattern marked earlier has largely played out with the decline. Price is now near 52-week lows (~₹980) after a ~33% drop, testing key support zones.
👉Current chart shows the structure with potential upside (pink arrow projection). Watch the purple horizontal levels for confirmation.
👉Sector headwinds (AI disruption, H-1B/PERM news) remain, but high ROE, decent dividend yield & oversold readings are in focus.
👉Join telegram for live updates, link in Bio.
#INFY #Infosys #TCS #TCSN #NiftyIT #StockMarketIndia #TechnicalAnalysis #ChartPattern #Nifty #ShareMarket #ITStocks #TradingView #IndianStockMarket #trendingréels #HappyNavratri
👉Gold (XAUUSD) — Long-Term Breakout Structure IntactSpot gold is holding near $4,194–$4,195 after Friday’s strong rebound off the mid-week lows.
👉The monthly chart shows a clean multi-year accumulation and breakout structure, with price now well above key Fibonacci retracement zones (0.5 at ~$3,608 and 0.618 at ~$3,138).
👉The larger technical picture remains constructive — volume profile and price action continue to support the broader bullish thesis toward higher targets over the coming years.
👉Near-term watch: Hold above ~$4,160–$4,180 for continuation
👉Next resistance cluster ~$4,220–$4,230
👉Deeper support remains the $4,060–$4,100 zone from this week’s lows
👉Macro backdrop (softer oil, yields pulling back from extremes) helped the Friday bounce, while Fed rate-hike expectations still linger.
👉The long-term chart continues to favor higher prices on the multi-year horizon.
👉Join telegram for live updates, link in Bio.
#Gold #XAUUSD #GOLD #GoldPrice #PreciousMetals #XAU #GoldTrading #Trading #Forex #TechnicalAnalysis #TradingView #Commodities #SafeHaven #Bullion #MarketUpdate
#trending #HappyNavratri
🗒️Nifty 50 Update | Bounce from Operator Line Bottom
📈Yesterday (Oct 8) Nifty closed sharply lower at 22,231.80 after testing fresh lows near the long-term Operator Line Bottom support zone (around 22,100–21,560).
📉Today (Oct 9) the index staged a strong recovery, closing at 22,520.45 (+288 points / +1.30%), snapping the recent losing streak with broad-based buying led by IT names.
👉Charts show price holding the Operator Line Bottom. A sustained move above the recent swing can open the measured upside zone towards 24,083 (approx. +2,511 points / +11.6% from the marked base).
👉Key levels to watch:
👉Support: 22,180–22,100 / Operator Line Bottom
👉Resistance: 22,550–22,700, then higher towards the 24,000 zone
👉Trade with strict risk management. Not a recommendation.
🤝Join telegram for live updates, link in Bio.
#Nifty50 #Nifty #Sensex #StockMarketIndia #NSE #BSE #DalalStreet #Trading #Intraday #SwingTrading #TechnicalAnalysis #MarketUpdate #IndianStockMarket #ShareMarket #Investing #BankNifty #ITStocks #TCS #StockMarket
📈Nifty 50 | Harmonic Bottom identified.
📉Price has rolled over from the highs and is still working lower. On this harmonic map, the projected bottom sits at 21,575.
📈That zone is the line in the sand. A hold there opens the measured rebound toward 24,083 — about +2,511 points, or roughly +11.6% from the low.
👉Levels on the chart:
Harmonic bottom: 21,575
Rebound objective: 24,083
Invalidation: sustained acceptance below 21,575
👉Until 21,575 is tested and defended, this remains a projection, not a confirmed reversal. Structure first, then the move.
Join telegram for live updates, link in Bio.
#Nifty #Nifty50 #niftycrash #HarmonicPattern #StockInNews #StockMarketIndia #Reversal #Crude
👉GOLD UPDATE | Head & Shoulders confirmed
👉XAUUSD has broken and closed below the neckline near 4,313 after printing a clear
Left Shoulder – Head – Right Shoulder structure.
💸Price is now trading around 4,101, well under the broken neckline.
As long as gold stays below the 4,313–4,400 zone, the bearish pattern remains active.
👉Key levels from the chart:
• Broken neckline / invalidation zone: 4,313 – 4,400
• Risk area (failed breakdown): 4,467 – 4,692 • Current price: ~4,101
• Downside objective 1: 3,789
• Downside objective 2: 3,530
👉Structure favors sellers while price holds under the neckline. A reclaim and hold above 4,400 would weaken the setup. Until then, rallies into the broken neckline are the zones to watch for continuation lower.
👉Join telegram for live updates, link in Bio.
#XAUUSD #Gold #GoldTrading #Forex #ForexTrading #PriceAction #TechnicalAnalysis #HeadAndShoulders #XAU #Trading #GoldPrice #MarketAnalysis
👉Nifty perfectly dancing to our Harmonic tunes in Live Trading session.
👉Nifty perfectly respected our harmonic PRZ yesterday and Dot reversal from our harmonic PRZ
👉RBI policy has announced and we have already play this move by harmonic.
👉Join telegram for live updates, link in Bio.
#Nifty50 #Livetrading #NiftyExpiry #RBIpolicy #niftycrash #PositionalTrading #LiquidityHunt #ShortTrap #PRZ #OperatorZone #WeeklyClose #IndianMarkets #NSE #StockMarketIndia #MarketStructure #TradingSetup #Sensex #ExpiryDay
📈Today #Nifty swept again the late-short liquidity right into our PRZ zone near 22,400 (intraday low 22,397), then reversed and closed at 22,776 — trapping the sellers who chased the dip.
👉Same script as yesterday. Markets don’t crash just because the timeline is bearish. They finish collecting the other side’s stops first.
👉Tomorrow is the #RBI policy and some dip we can expected because market has already hunted the liquidity of the late sellers.
📉All Positional sellers who entered late into the zone have already got trapped and market is going up and up only.
👉Key rule stays the same: No structural crash thesis until a weekly close below 22,000.
📈Sustained break and weekly close below 22,000 → only then does the deeper downside path open.
👉Don’t trade the noise. Trade the level. Late shorts just got the receipt.
👉Join telegram for live updates, link in Bio.
#Nifty50 #NiftyExpiry #RBIpolicy #niftycrash #PositionalTrading #LiquidityHunt #ShortTrap #PRZ #OperatorZone #WeeklyClose #IndianMarkets #NSE #StockMarketIndia #MarketStructure #TradingSetup #Sensex #ExpiryDay
Everyone is still pricing a Nifty crash toward 21,000 / 20,000 / 18,000.
Price just did the opposite again.
📈Today Nifty swept the late-short liquidity right into our PRZ zone near 22,400 (intraday low 22,397), then reversed and closed at 22,556 — trapping the sellers who chased the dip.
📈Same script as yesterday. Markets don’t crash just because the timeline is bearish. They finish collecting the other side’s stops first.
📉Expiry day tomorrow. Positional sellers who entered late into the zone are already under pressure. A sharp short-covering move remains on the table while structure holds.
👉Key rule stays the same: No structural crash thesis until a weekly close below 22,000.
👉Above 22,400–22,450 → bounce path toward 22,700–22,850 first on expiry.
👉Only after that zone is tested do we reassess the next leg toward 23,475.
👉Sustained break and weekly close below 22,000 → only then does the deeper downside path open.
👉Don’t trade the noise. Trade the level. Late shorts just got the receipt.
👉Join telegram for live updates, link in Bio.
#Nifty50 #NiftyExpiry #Nifty #niftycrash #PositionalTrading #LiquidityHunt #ShortTrap #PRZ #OperatorZone #WeeklyClose #IndianMarkets #NSE #StockMarketIndia #MarketStructure #TradingSetup #Sensex #ExpiryDay
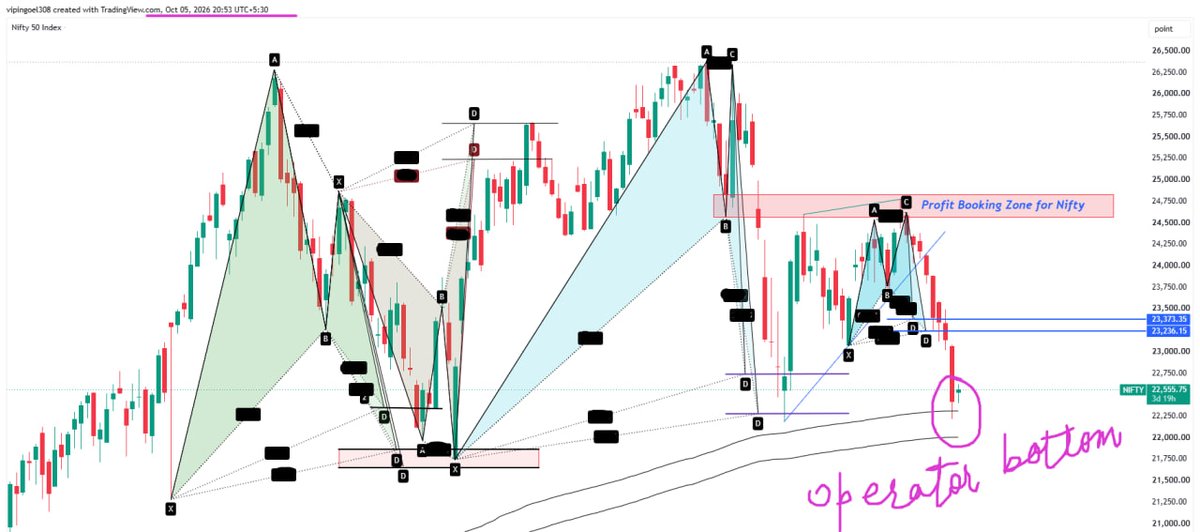
👉Everyone is pricing a Nifty crash toward 21,000 / 20,000 / 18,000 / 17,000.
Price is saying something else.
📈Nifty is sitting on a crucial long-term zone — right at the operator line — after already sweeping fresh short liquidity.
📈Markets don’t crash just because the timeline is bearish. They crash after they finish collecting the other side’s liquidity.
📉This week, positional sellers may still get hunted. A sharp reversal or fast pullback remains on the table while price holds structure.
👉Key rule for the positional setup: No structural crash thesis until a weekly close below 22,000.
👉Above 22,000 → sharp bounce toward 23,475 first.
Only after that zone is tested do we reassess the next leg.
👉Weekly close below 22,000 → only then does the deeper downside path open.
👉Don’t trade the noise. Trade the level.
🤝Join telegram for live updates, link in Bio.
#Nifty50 #Nifty #niftycrash #PositionalTrading #LiquidityHunt #OperatorZone #WeeklyClose #IndianMarkets #NSE #StockMarketIndia #MarketStructure #TradingSetup #Sensex
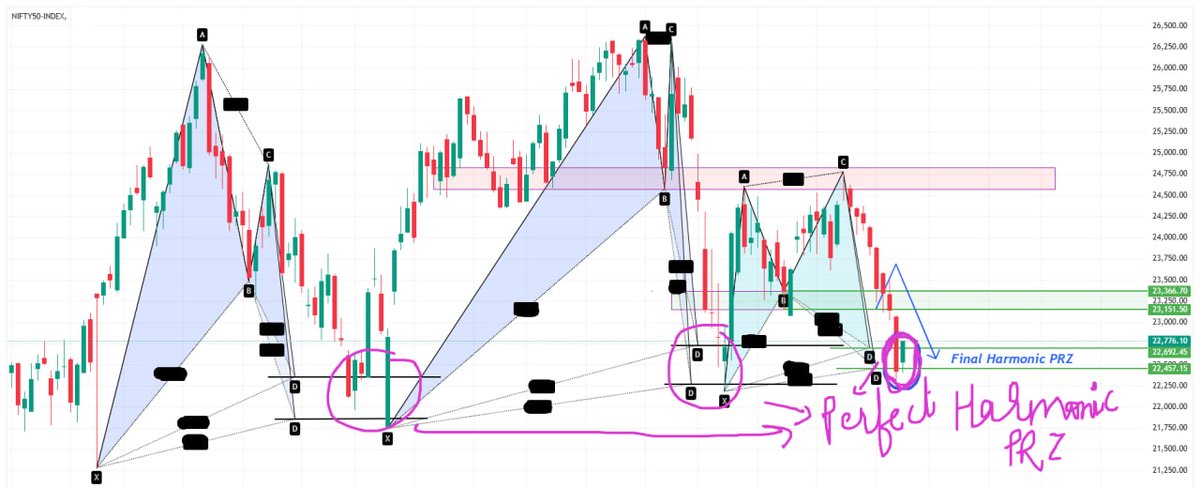
#Nifty Harmonic positional setup for Tuesday or this week setup.
👉Nifty downside Harmonic pattern has been activated, and it is going towards 22697-22457.
👉Nifty Bigger range is 22870-24024.Either side breakout or breakdown will give you one side rally.
👉Join telegram for live updates, link in Bio.
#nifty #niftycrash #nifty50analysis #niftyprediction #TradingSetup #StockMarket #Monday #Tuesday #Harmonicpattern #Chartpattern #Trending #scalping #expiry
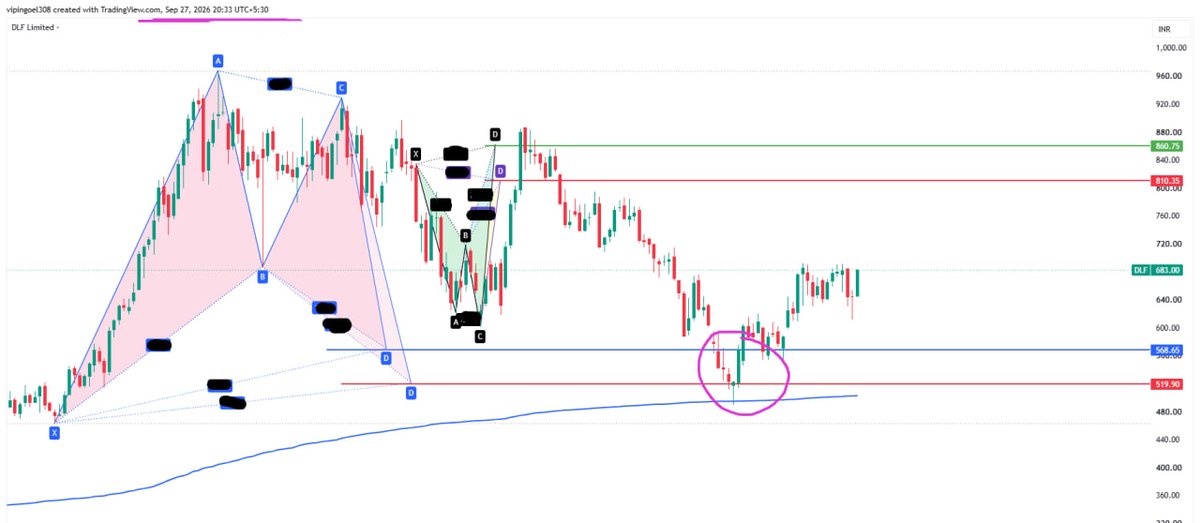
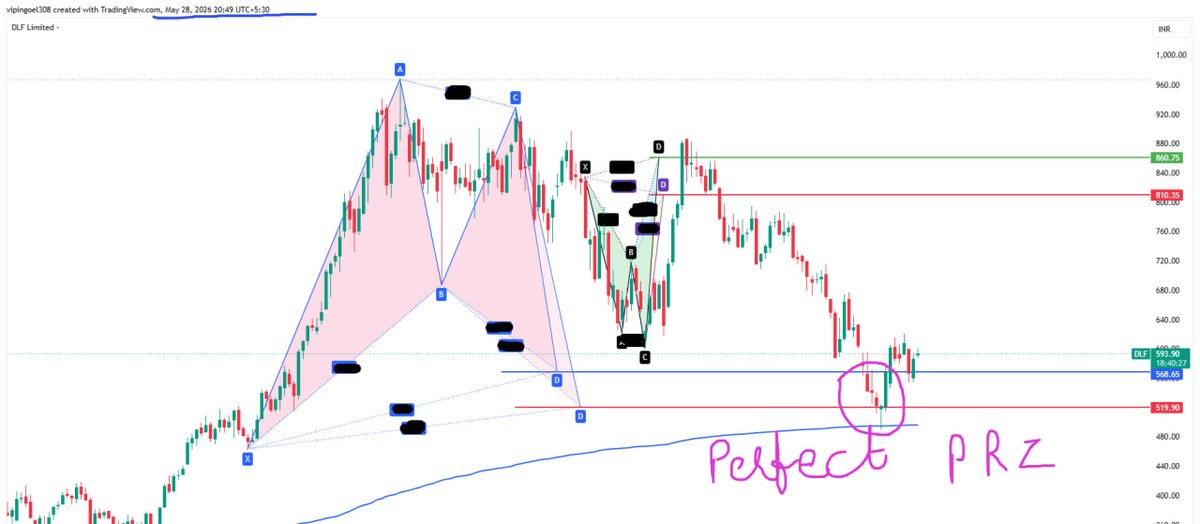
📈DLF | Harmonic PRZ bounce in play.
👉Price respected the Potential Reversal Zone near 520 and bounced cleanly.
👉CMP ~681
Supports: 568 / 520
Resistances / Upside Potentials: 810 → 860
👉Structure still constructive after the pattern completion. Watching for follow-through.
👉Not financial advice. DYOR.
👉Join telegram for live updates, link in Bio.
#DLF #Nifty50 #niftyrealty #StockMarketIndia #IndianStockMarket #TechnicalAnalysis #HarmonicPattern #PRZ #StocksToWatch #DalalStreet #TradingView