Vector databases have raised billions offering hosted management of text embeddings. What are you revealing in these vectors ? 🔒
We demonstrate a practical method for full recovery of 90% of sentence length embeddings (https://t.co/JNBN7mm3Wu).
🌟 Excited to announce the Stanford Graph Learning Workshop 2023 on Oct 24 2023!🤝 Bringing together academia & industry leaders to delve into advances in #MachineLearning & #AI in Relational domains, Foundation models, and Multimodal AI. 📢 Free registration. 📢 Calling for talks & poster/demo submissions! Showcase your innovative work in methodological advancements, diverse domain applications, & ML frameworks.
https://t.co/JtU9DDW0Fd
The way Datadog calculates percentiles at scale is very innovative 🔥
Usually, calculating the percentiles of large datasets is very expensive.
To know the 99th percentile of a stream of values, you need to:
- keep all the values
- sort them
- return the value whose rank matches the percentile (e.g 99th item)
Datadog cannot afford to do this with the many millions of data points that come in every second - the space and CPU requirements are not practical for a company with thousands of customers. 🐾
Naturally, they opted for sketch algorithms - those should provide them with a good-enough probabilistic result while being vastly more efficient to compute.
Unfortunately - they couldn’t get satisfactory results.
The algorithms would produce results that were too inaccurate. ❌
Why?
Many percentile sketches had guarantees in terms of *rank error*.
A rank-error guarantee of 2% means that the p95 value returned by the sketch is somewhere between the p93-p97 value.
But system latencies exhibit very fat tails - the difference between the p97 and p99 values can be 2-10x!
So what did the dogs do? 🐶
They invented a new sketch algorithm - DDSketch.
Instead of rank error guarantees, they designed it for *relative error* guarantees.
If the p99 is 60s, a 2% error means the sketch would return 58.8-61.2s.
The algorithm is surprisingly pretty simple:
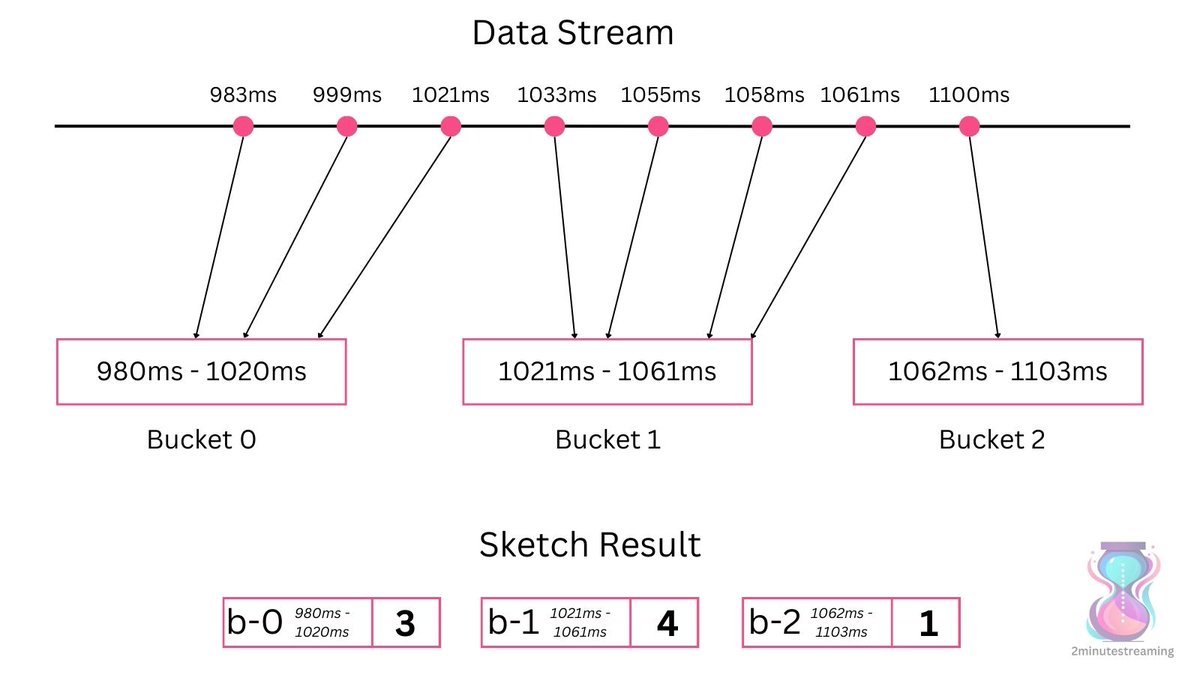
• They create buckets covering ranges of the desired error rate. (+- 2% in this case) 🪣
• Each bucket keeps a counter of the amount of data points within that range. 💯
• When processing an item (latency metric data point), increment the counter of the appropriate bucket. ➕
• To count the desired percentile, you sum up the bucket’s values until you get to the desired percentile. Whatever bucket that percentile is in - that’s your value. 🏆
In this example, the 50th percentile is 1033ms. (4th value out of our total of 8)
Going by count, the 4th value is in the second bucket (b-1) and the algorithm would produce a result of 1021-1061ms.
To cover the range from 1 millisecond to 1 minute, you only need 275 buckets.
With 64-bit counters, that's just ~2kB of memory, regardless of the amount of input data.
This is why we call sketch algorithms sublinear in space growth - memory requirements do NOT grow linearly with input.
The exponential nature of the bucket distribution makes it cheap to cover an even wider range: 1 nanosecond to 1 day takes just 3x more buckets:
• 802 buckets at ~6kB.
As you can probably tell, this is pretty easy to parallelize.
You can divide this bucket-building exercise into many parallel lightweight substreams, and then merge the results freely. 🕊
The merge operation is a simple sum of the buckets & their counters, which ensures that the accuracy is kept in the same range.
It is a very scalable and performant sketch algorithm.
Kudos to Datadog for inventing it.
Good boy! 🫳🐕🦺
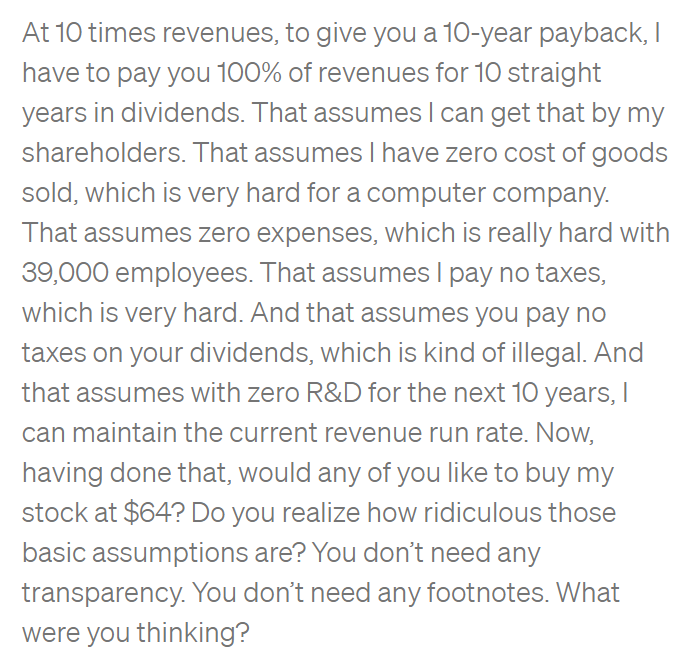
Given the Nvidia valuations, I think it's worth sharing this anectode from the 2000s.
At its peak, the Sun Microsystems stock hit valuation of 10x sales.
When stocks took a massive beating later on, this is what its CEO Scott McNealy had to say to investors:
📣Ready to dive deep into the world of #MachineLearning with Graphs? 🌐 Our new online class explores how diseases & information spread, traffic & weather predictions, & so much more!
Join us, & make sense of the world's complex data🚀.
https://t.co/04L9TjSbCc We kick off on June 5th!
#DataScience #OnlineCourse @StanfordEng
Introducing the BigCode Evaluation Harness for Code LLMs:
https://t.co/InCoQoc28O
Inspired by the lm-evaluation-harness from @AiEleuther, it ensures ease-of-use, reproducibility and efficiency. Let’s explore its key features 🧵:
Pretty proud of the @Spotify team for this one – a generative, expressive and realistic AI DJ that delivers a personalized lineup of music and commentary to each user, for all those times you don’t know exactly what you want to hear. Hope you like it! 🎧 https://t.co/4PwXKUW0Cl
@free 6 mois que j'ai demandé la résiliation de ma ligne, uploadé les docs 3 fois, et vous n'en avez toujours pas pris acte? L'efficacité en bande organisée.
@bernhardsson@modal_labs Turns out I am now the head of solution engineering at @KensuIO and I think there is an awesome synergy to add data observability capabilities to Modal functions by integrating with our agents and our Community Edition.