Today the #CARBON Team is releasing Vol 4 of Carbon Team #News, the #science#communication magazine of the Brazilian #LEOC-@FURG biogeochemistry group.
Check it out there!
Access the magazine's full content in https://t.co/KkZVQgZMvP
https://t.co/cu6nD8ppQP via @YouTube
Delighted to see our paper out, where we uncovered striking spatial variability in the marine carbonate system across a broad area of the #SouthernOcean, showing how physical–biological processes shape ocean carbon dynamics during the austral summer.
https://t.co/dQ1BhLhu1B
#LEOC postdoctoral researcher Dr André Brum has begun his research visit at @NOCnews. He'll work with our alumnus and ongoing collaborator Dr Tiago Dotto on spatio-temporal variability of eddy fluxes around the Antarctic continental shelf.
Our #LEOC member @thiagoarckhell will help promote understanding of ocean acidification in the Southern Ocean and strengthen vital communication and collaborations between @SOOSocean, @Polar_Research, and @goa_on. Wishing you all the best, Thiago! 🤗
👏The new SO-OA Hub proudly welcomes its first ECR Representative, @thiagoarckhell!
As an oceanographer @FURG Thiago will help set-up the hub & drive comms & collaboration between @Polar_Research, @goa_on & SOOS. 🌊💙
Join us in congratulating him: https://t.co/k07b3YzpeP
Explorando o extremo sul do planeta, juntos fazemos história! 🇦🇶🤝🇧🇷🌎🚢🌟
Essa é a equipe brasileira que integra a ICCE (International Circumnavigation of Antarctica Expedition), a maior circum-navegação da Antártica já realizada, liderada pela UFRGS!
Check out this fantastic contribution to understanding the influence of air-sea fluxes on the export of intermediate and modal subantarctic waters from the Southern Ocean in climate models.
💡The CLIVAR/@CliC_WCRP/@SCAR_Tweets Southern Ocean Regional Panel (SORP) presents its third seminar in the quarterly series at 15:00 UTC,December 3rd by Dr. Sebastiaan Swart (University of Gothenburg, Sweden).
👉 Register now to attend: https://t.co/JvVadQpytb
Maurício Santos-Andrade et al.* look at the drivers of the marine carbonate chemistry system in the Bransfield Strait off the Northern Antarctic Peninsula
https://t.co/j8RaX2Xklv
#ocean#co2#CarbonateChemistry
*R. Kerr, I. B. M. Orselli, T. Monteiro, M. M. Mata, C. Goyet
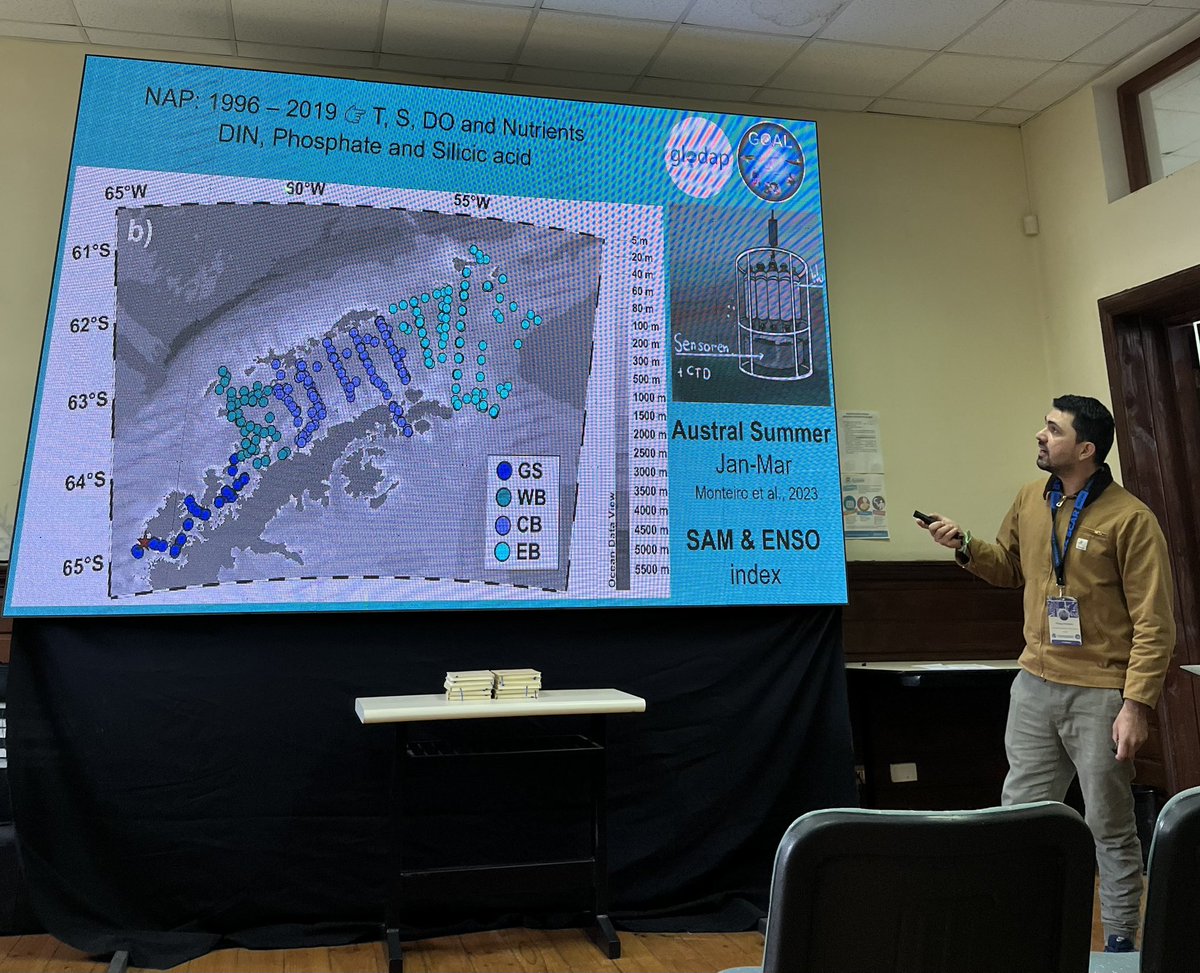
Delighted to fly the flag for our study on macronutrient in the #SouthernOcean from a fantastic time series from the Brazilian High Latitude Oceanography Group & #GLODAP, during #SCAR2024. Also to see so many fantastic talks on #biogeochemistry in this key region of our planet.🥰
Members of the Brazilian High Latitude Oceanography Group (#GOAL) and colleagues from #INCTdaCriosfera are present at #OSC#SCAR2024@SCAR_Tweets to discuss the main studies and challenges of Antarctic research.
If you are participating in #SCAR2024@SCAR_Tweets and are as excited about stickers as I am, come pick up some great stickers from our @leocfurg projects and groups. 🤩
After an exciting week at the Latin American Conference on Marine Sciences and the Brazilian Conference on Oceanography, we are heading to #SCAR2024@SCAR_Tweets to talk more about #Antarctica and our studies from @leocfurg. 🥰
To all UK journalists: the climate crisis needs to feature more in this election campaign. You have an opportunity to put climate change on the front pages tomorrow.
Ask @UniofReading for the images you can use.
#ShowYourStripes
SOCAT v2024 is released today, with 3.9 million new observations.
Download the new version from https://t.co/jfvVf3fYPm
A poster summarising the key points of the release (including the continued decline in observation coverage) is available from: https://t.co/rphufWsA25
Esses gráficos foram pensados e desenvolvidos pelo professor @ed_hawkins e são excelentes ferramentas para começar uma conversa sobre #MudançasClimáticas.
Acesso o site https://t.co/ndFlPyOE4o e veja o gráfico para a sua região, disponível para todos os estados do Brasil.
Ontem começou o #inverno no Hemisfério Sul… mas vamos falar de calor. 🥵
Hoje é o #ShowYourStripes day, o #MostreSuaFaixa 🌡️ um dia dedicado aos gráficos de “faixas de aquecimento”, que são representações visuais da mudança de temperatura medida em cada região do planeta.
Na primeira figura podemos ver as mudanças de temperatura no Brasil nos últimos 113 anos. As faixas em azul representam baixa temperatura e em vermelho alta temperatura. Ou seja, estamos experimentando cada vez mais altas temperaturas, como tem sido observado em todo o planeta.
Have you heard?
We are bringing OA Week back for 2024! 🌊
Help us find a date for the week-long online symposium, bringing together researchers across the world with thematic sessions, plenary talks, and engaging discussions about OA research.
Survey: https://t.co/3AGx5cdyc3