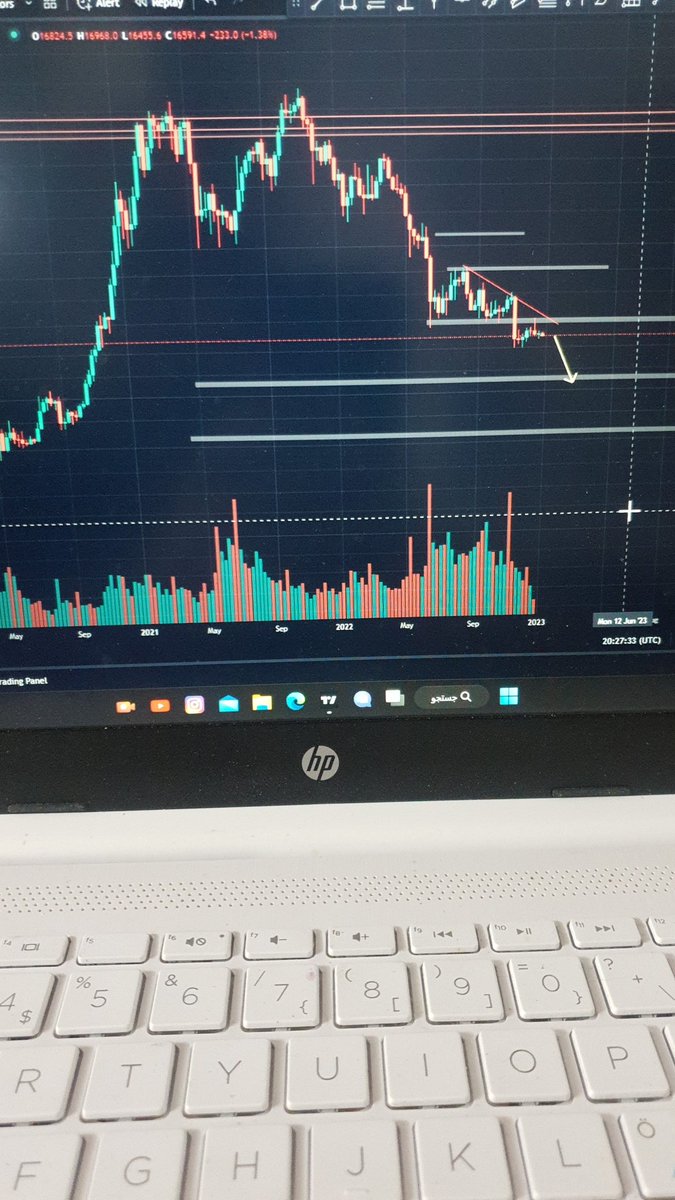
The rising wave of bitcoin will be in the form of 3 waves, and after the completion of this schematic, the downward trend will continue... What do you think?? The price areas inside the chart are not exact and are considered areas
The last monthly Bitcoin candle is very small. It is quite clear by checking the price in weekly and daily times. This means that the downward trend has weakened
Hello traders... the weakness of the trend can be seen in Bitcoin, if the trend changes, lower prices are available. The 13500 range is the first range.
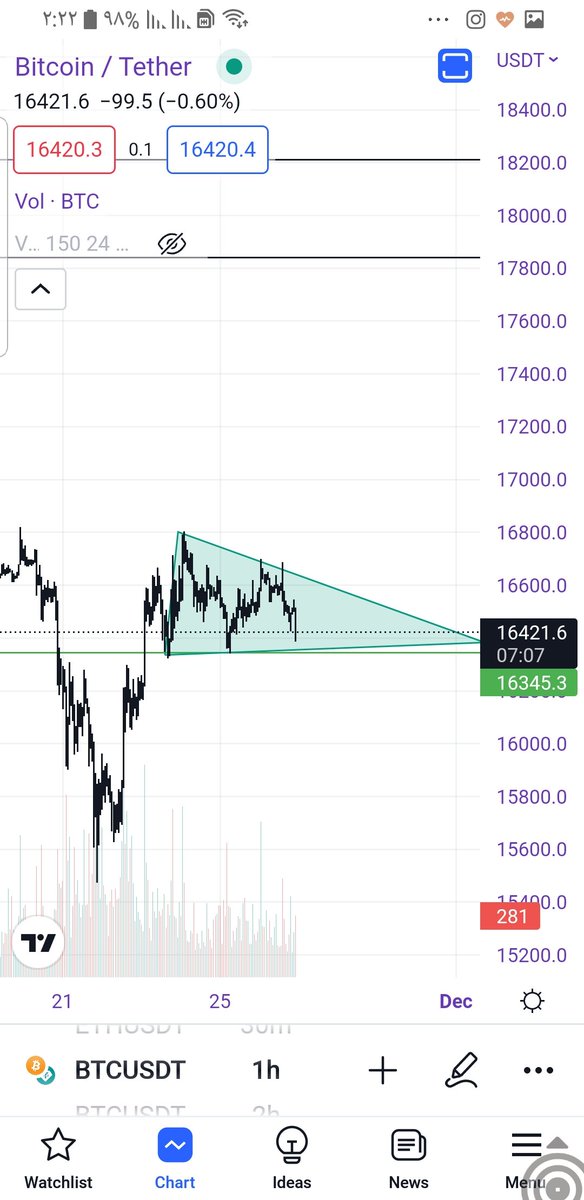
It won't happen again like this mistake. It was a big mistake. It was two days ago that I realized that the price will be reject and updated with the new post (green triangle) for you.
Friends, Bitcoin has been supported and there is a high possibility that it will reach 18,000 and 20,000, but the long-term trend is downward, and buying a step can be very suitable in the areas below 15,000. It is really cheap and valuable at these prices.
This green triangle is decisive for the time being, and if the price comes out from any side of the triangle... it will be the same,
what is your opinion?
Friends, Bitcoin has been supported and there is a high possibility that it will reach 18,000 and 20,000, but the long-term trend is downward, and buying a step can be very suitable in the areas below 15,000. It is really cheap and valuable at these prices.