@Brad_Setser I fully understand your points, but I think the flow focus tends to distract from simple mon pol impact which is at least as important for these free or near free float cases.
On these speculations about why JPY, KRW, and TWD are so weak: I think the explanation is much simpler.
I can count capital flows as well as the next man, but I feel that the “flow guys” are taking their obsessions a bit far when simple PPP logic may suffice.
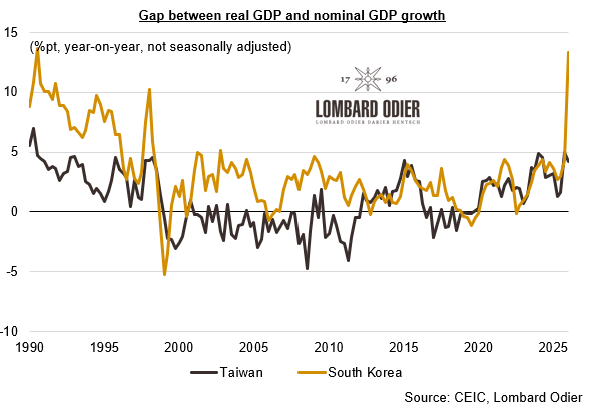
South Korea's historic gap between real GDP and nominal GDP growth has prompted Bank of Korea Governor Shin Hyun Song to sound like @DavidBeckworth and @MoneyIllusion as he builds his case for rate hikes. https://t.co/97oBYmVJ6I
@Brad_Setser Well, market participants might be simply taking the view that relative inflation picture for these countries is shifting in light of recent timid responses to big NGDP boost. Breakevens hint at that. That’s consistent with weaker currencies. PPP isn’t just a valuation metric.
@Brad_Setser NGDP growth persistently higher than RGDP. Local rates not budging that much. Little movements in credit spreads. Rising breakevens.
Higher inflation expectations regardless of limited rate hike guidance = Weaker currencies (hence PPP reference). Mon pol is just too easy.
Looking through this prism, there is a simple explanation for the persistent weakness of both KRW and TWD: monetary policy has been too easy. We think it is appropriate for the BOK to start raising rates in H2 2026, and Shin is clearly hinting at this outcome.
South Korea's historic gap between real GDP and nominal GDP growth has prompted Bank of Korea Governor Shin Hyun Song to sound like @DavidBeckworth and @MoneyIllusion as he builds his case for rate hikes. https://t.co/97oBYmVJ6I
Some might argue that this is merely an echo of what Taiwan has experienced amid its enormous chip export boom, but South Korea's case is far starker. There, the gap between real and nominal GDP growth reached 13.3 percentage points in Q1, compared with just 4.3 points in Taiwan.
@darioperkins Japan’s old age dependency ratio didn’t change much between 2019 and now. But you have a big swing in 10Y JGB yields from negative to the current positive level. Perhaps something else is at work?
Well, I think my favorite econ professor at Penn highlighted this earlier, but to drive the point home: we are closing elementary schools in Seoul. Not rural towns. Seoul.
When I write about the long-run consequences of population decline, I’ve noticed that most people cannot grasp what a total fertility rate (TFR) of 1.1 means. Many of my readers look at 1.1 and treat it as not that different from 2.1. This is the wrong way to think about it: TFRs are like interest rates; they compound over time.
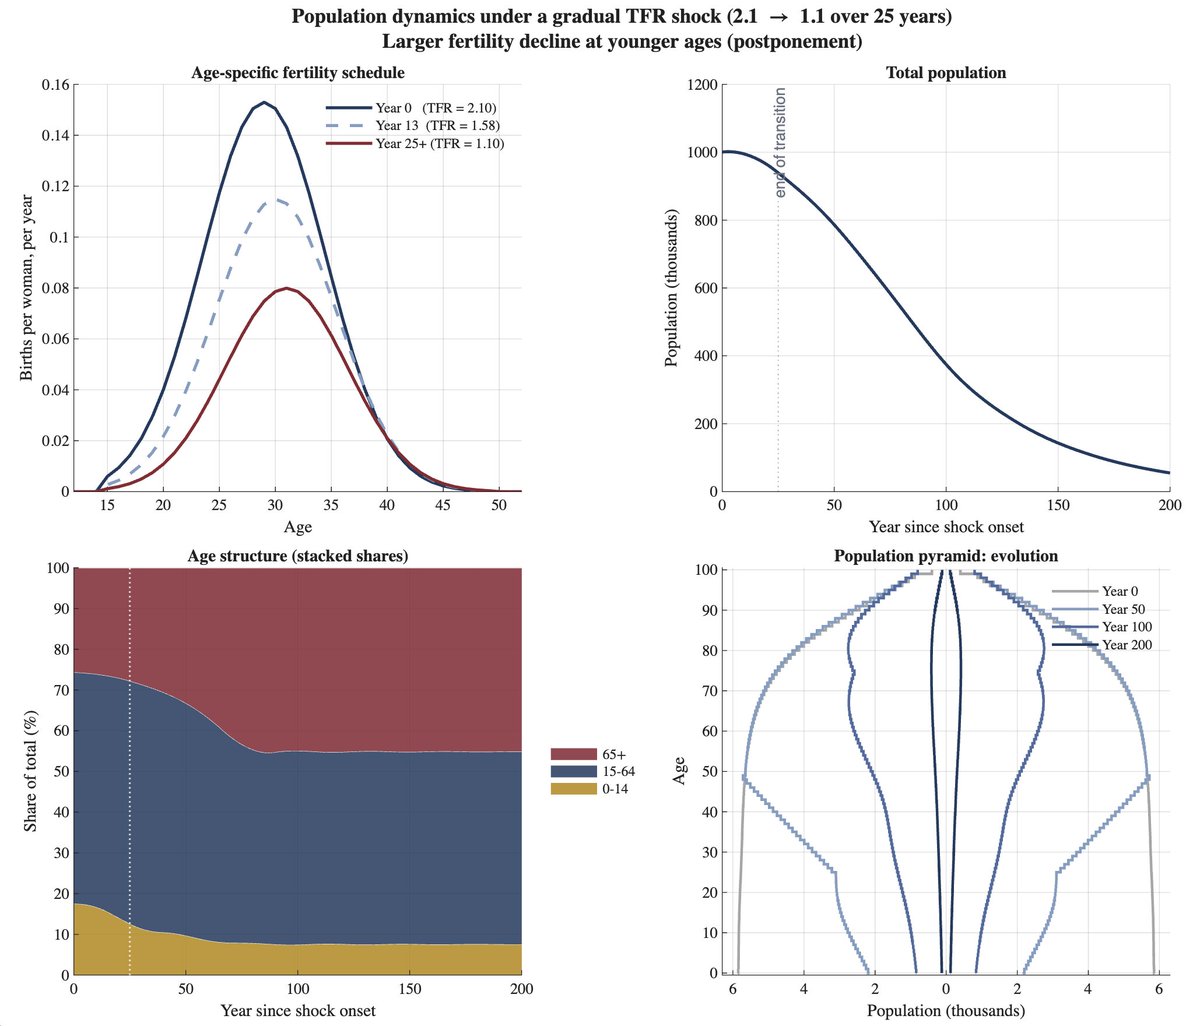
To make the point, I ran the following simulation. I built the population structure of a country with 1 million inhabitants, a TFR of 2.1 (just at replacement level), and a life expectancy of 85 (with realistic survival rates). Thus, this country has a stationary population over time.
I then hit this country with a reduction in the TFR from 2.1 to 1.1. The reduction, which takes 25 years to complete, is similar in size and duration to what we’ve seen in many advanced and middle-income economies. It is also concentrated among younger women, with fertility postponed to later years. I plot the initial, middle, and final TFR in the top-left panel of the figure.
I then simulate the next 200 years of this population. By the year 200, the original 1 million has fallen to 54,900, a 95.5% reduction. The top-right panel illustrates this evolution. This is not a minor adjustment: it means closing 95 of every 100 universities, hospitals, and shops. Since the population is likely to concentrate in a few remaining cities, nearly the whole country becomes a population desert.
The bottom two panels show the population structure and pyramids. The population stabilizes at a median age of 61 and an old-age dependency ratio of 95.21%.
You might argue that TFR is unlikely to remain at 1.1 for so long because higher-fertility subgroups (e.g., the highly religious) would grow as a share of the population. Fair enough. But I am not offering this simulation as a forecast. I am illustrating how, at current rates, countries of 50 million people (roughly South Korea or Spain) would become countries of 2.75 million, ignoring immigration.
These are the issues for the next century.
“… strong evidence that China’s rise was primarily driven by the National Reimbursement Drug List (NRDL) reform, which dramatically expanded the effective market size for innovative drugs” https://t.co/i2XoJbq0ul
@mtkonczal@mattyglesias 10 year breakeven rate peaked near 3% in 2022 and then declined to 2% at one point in 2024. That’s a pretty big move as far as ex-ante inflation outlook is concerned.
Takaichi Sanae, PM Ishiba's rival in the ruling LDP, is calling for consumption tax on food items to be lowered to 0%. This exacerbates Ishiba's isolation on the issue ahead of the tough upper house election in summer. https://t.co/lGqaf79Cvd
NVIDIA has enough money and business already. I think the long-term bifurcation is an existential threat to the company because it is a matter of time before a serious Chinese alternative to CUDA emerges in that era, even if their chips still lag the US's on paper.
We are on track to reduce our compute advantage over China from 33 to 1 to 1.2 to one because @nvidia and Jensen Huang put millions of dollars in Trump’s pocket in order to enrich themselves at the rest of our expense