Let's see how we will close today and this week, I have some cushion on my positions and happy to see $SCZM continuing showing strength with metals in general.
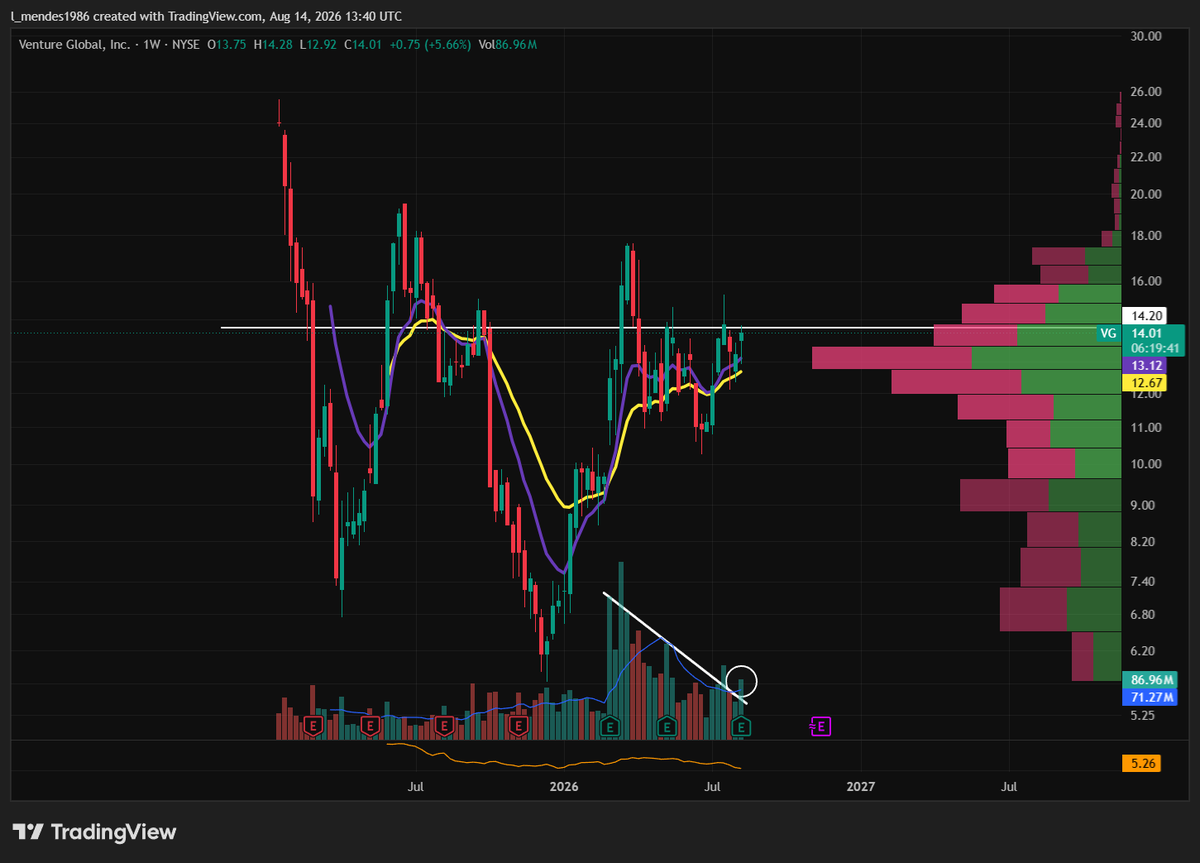
$HPE $THEON
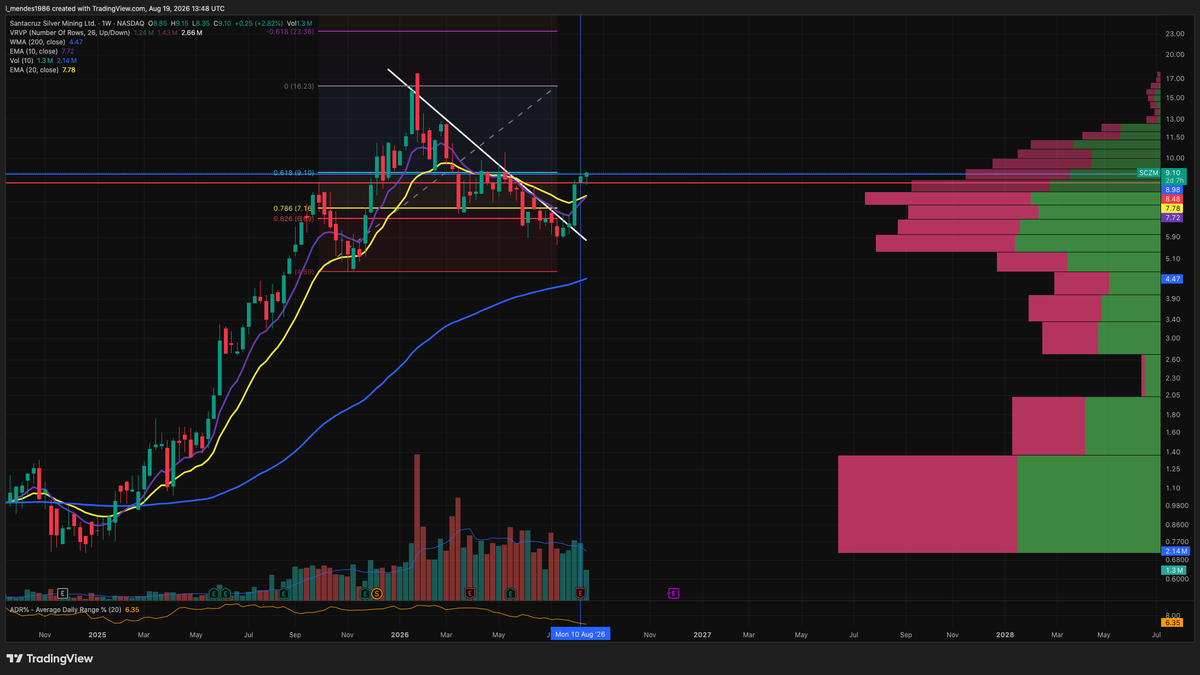
$SCZM (Santacruz Silver Mining - Weekly Chart)
$SCZM showing strength today with metals joining the move.
The 0,618 Fibonacci level around 9,10$ is the one to break and it won't be easy.
If strong volume can join the move, that would be a good start. Now I want to see how price develops during the day and, more importantly, how we close the week.
Crazy how yesterday and even today in premarket everything was telling me that I might need to sell, and only a few hours later you get the start of a potential push higher.
That's how difficult this market has been to trade.
Super tough year so far. Still waiting to finally get something going for an interesting period instead of constantly fighting for every move.
But the market isn't here to please me :-)
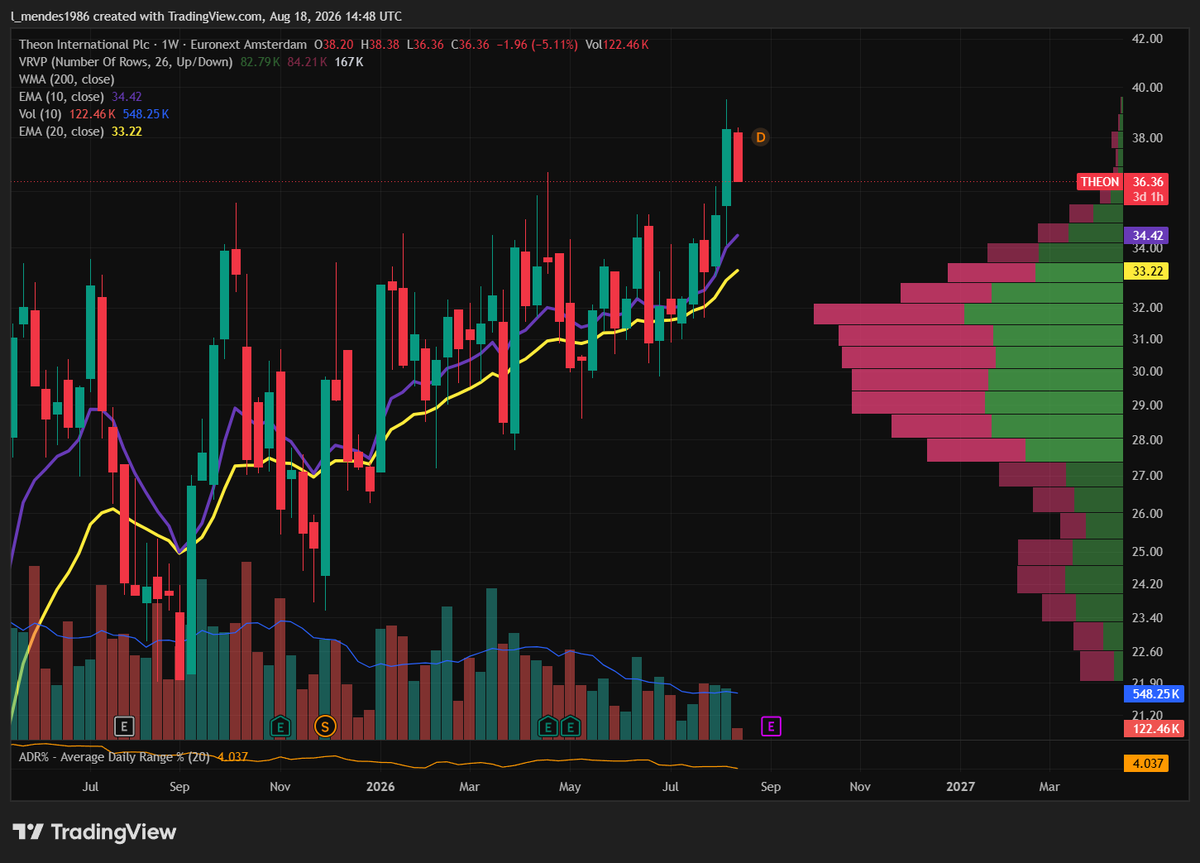
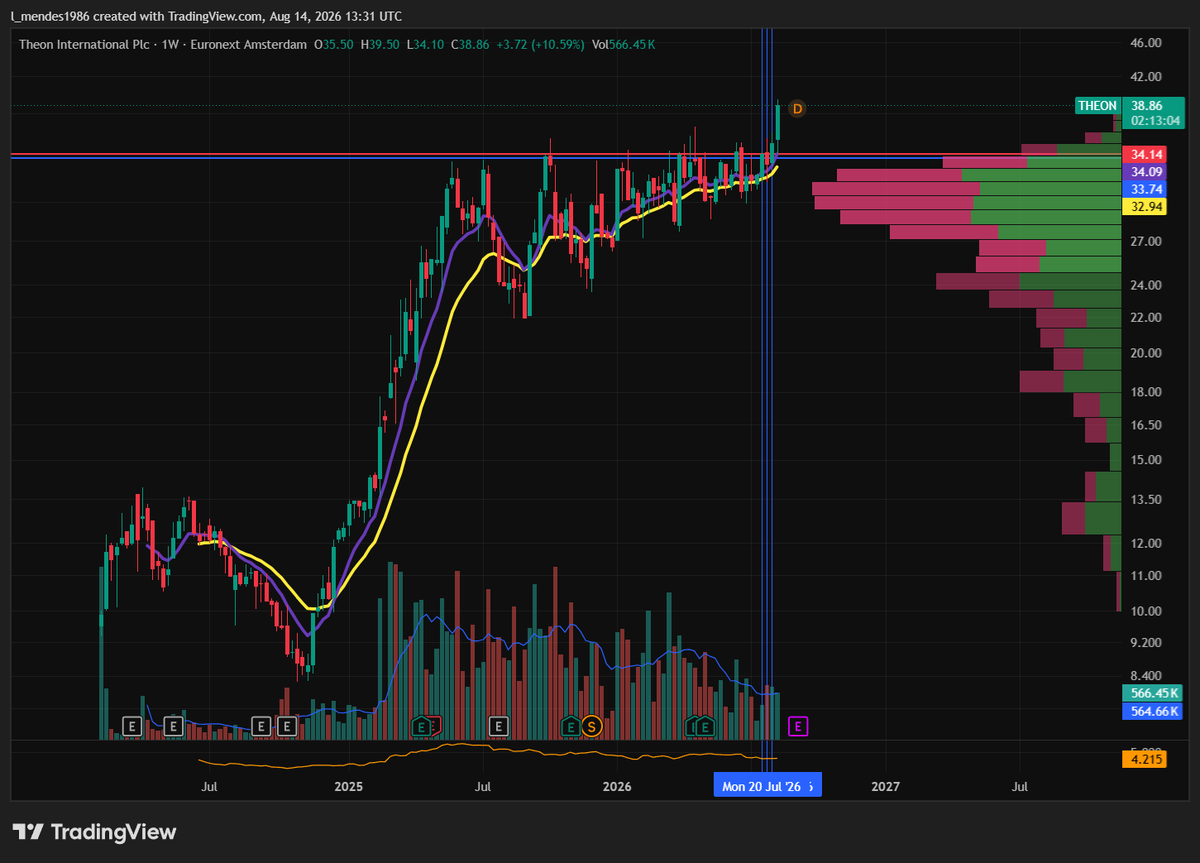
$THEON (Theon International - Weekly Chart)
On $THEON you can clearly see my 3 buying points just before the breakout. (clue crosses)
I actually got stopped out a few weeks before and decided to retry the setup when the structure gave me another opportunity. Luckily I did.
I took some profits after the first pop and let the rest of the position work.
Now we are getting the first real pullback after the breakout and obviously I hope this doesn't turn into a false breakout and a full move back into the previous range.
For now the structure is still intact and I still have some cushion.
The 10 EMA is my guide from here.
If the breakout holds, great. If it doesn't, I'll follow my rule and protect the remaining position.
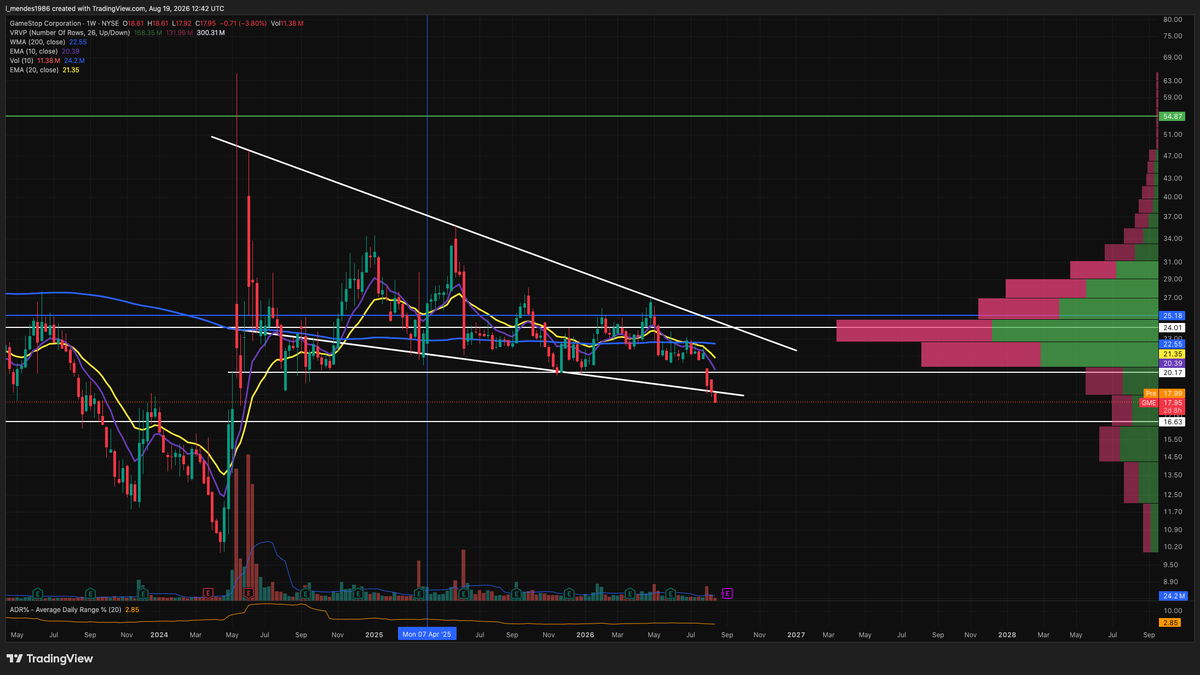
$GME (GameStop Corp. - Weekly Chart)
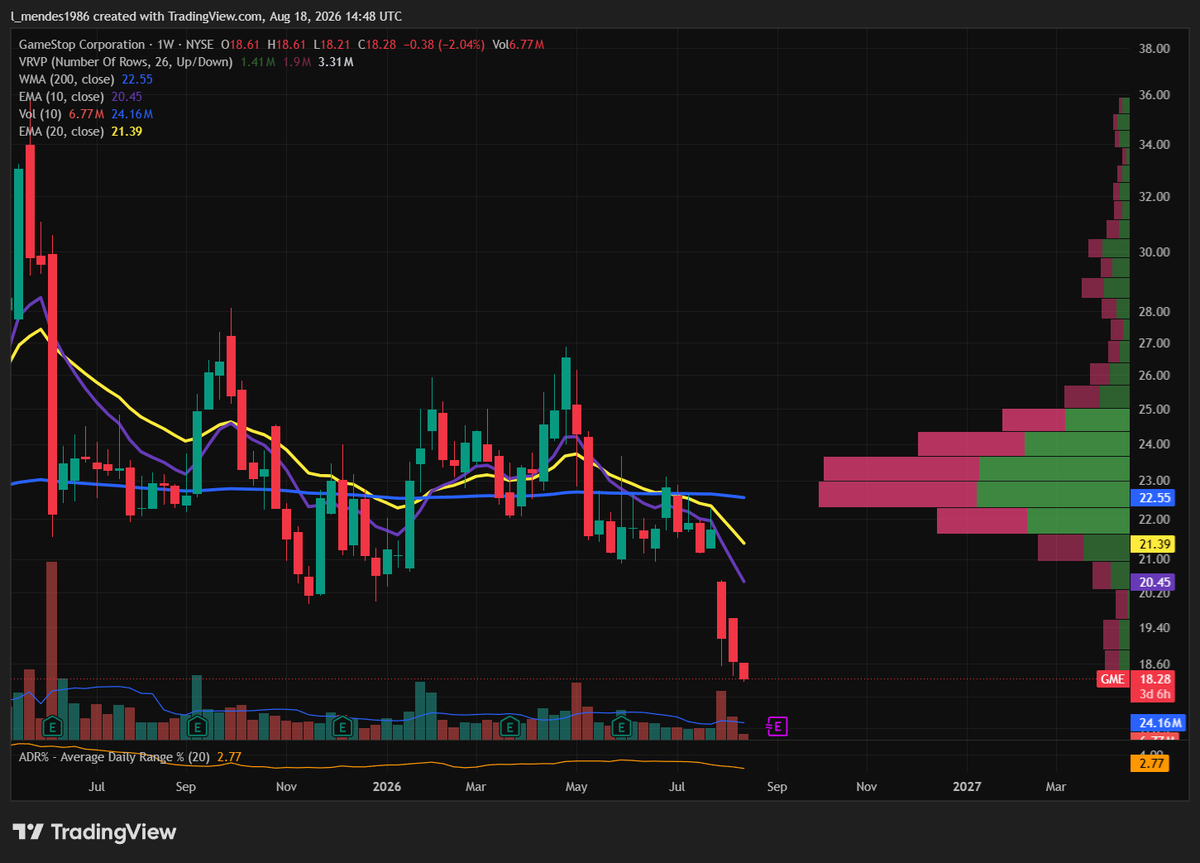
GameStop continues to show a horrible structure and I still believe 16,50$ is a real possibility if nothing changes and selling pressure continues.
Price is below the 10/20 EMA, momentum continues to point lower and for now buyers simply aren't showing enough strength to change the picture.
That being said, we all know how brutal a rebound in $GME can be, especially with earnings approaching or if we "finally" get a real catalyst/news that changes sentiment.
For long-term shareholders this is certainly frustrating, but there is no point sugarcoating what the chart is showing.
Volume and real buying pressure need to come back first.
Current positions update
Yesterday was a tough day...
Not every red day is a problem, but yesterday was different. We saw weakness across several names/sectors and some positions lost momentum.
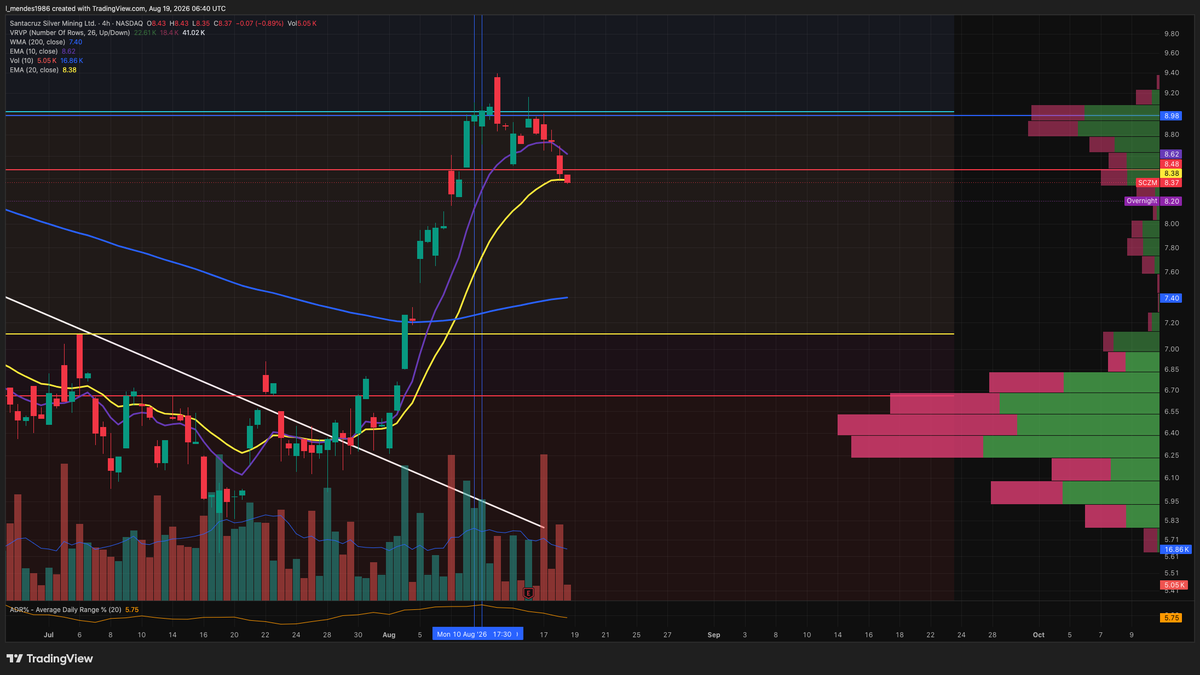
$SCZM is the one I am watching the closest.
The breakout attempt lost some strength and the overnight action is not helping. I will wait for the market open before making a decision, but if the breakout fails and price cannot recover, I won't hesitate to protect capitaland close my position.
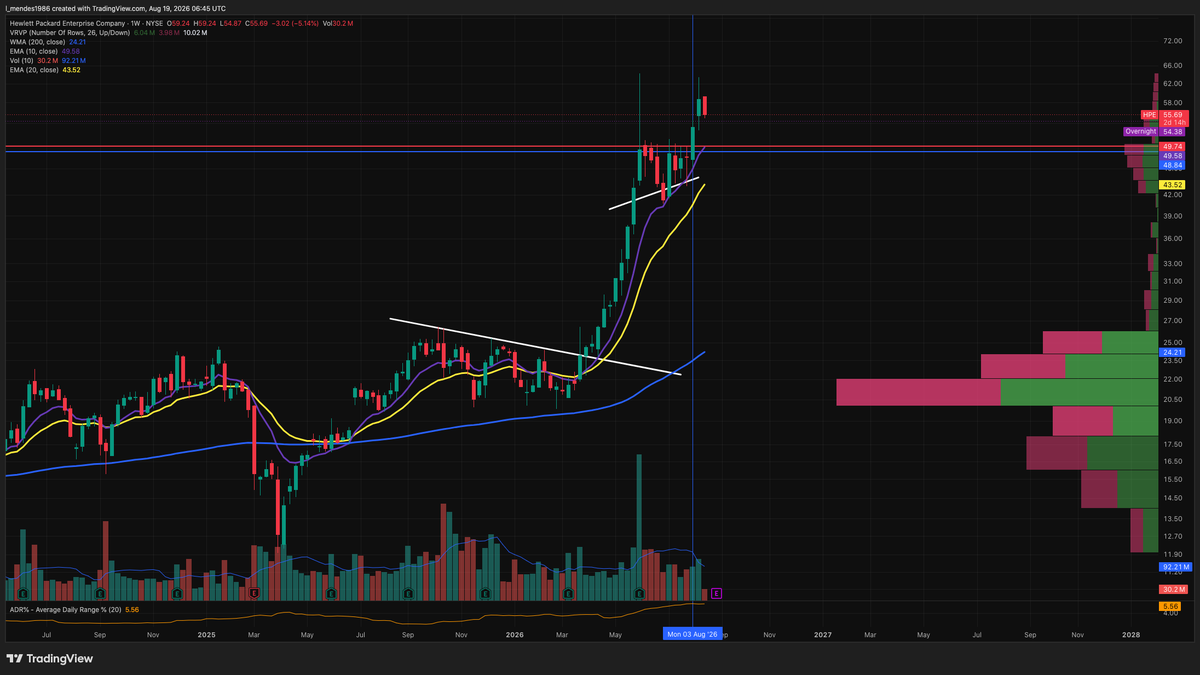
$HPE still has some cushion after the strong move and partial profit taken. I'll let it play out this week and the 10 EMA will be my guide.
Same for $THEON. It went from around +20% to +10%, but the weekly structure is what matters. If it loses the 10 EMA, I will close the position.
Time to be patient, alert and observe where we go and what I do from here
Red day today all over my positions but it's all about how we will close this week. No need to post 1000 times today as it's a no action day for me
$SCZM $THEON $HPE $GME
$FCEL (FuelCell Energy Inc. - Weekly / 4H Chart)
Still really liking this structure.
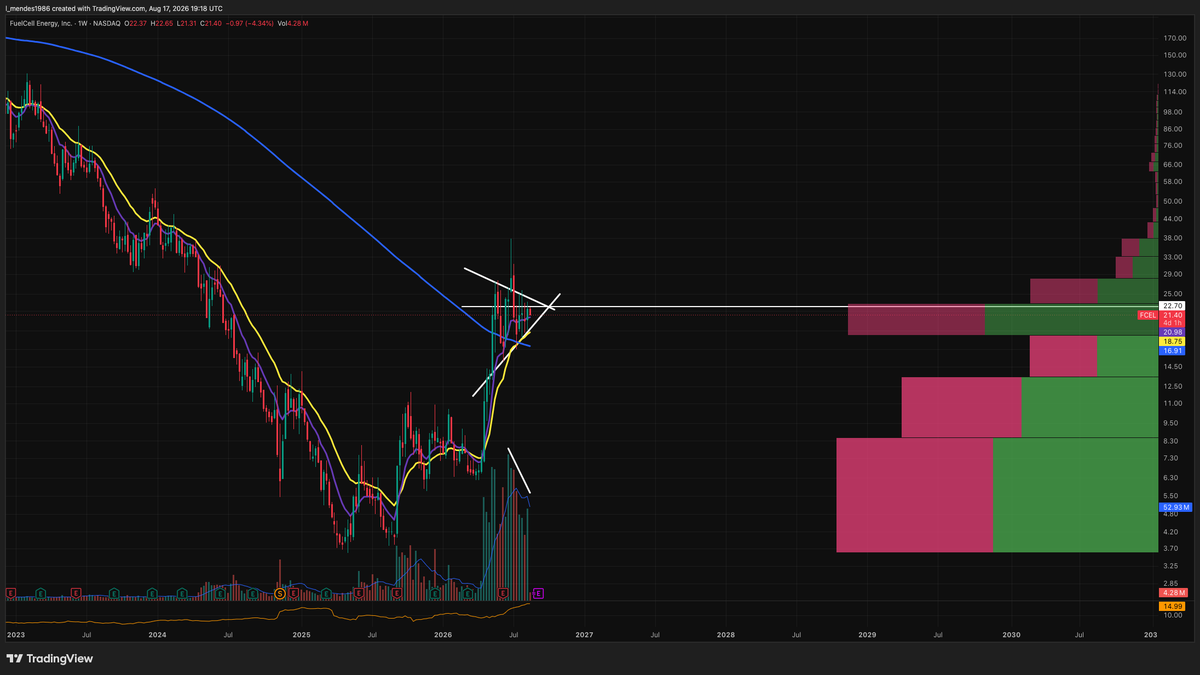
Week just started, but for now $FCEL continues to hold around the 10 EMA while the 4H keeps flagging and tightening underneath the 22,70$ area.
What I particularly like is that the 10/20 EMA are compressing around price while the rising 200 MA is sitting underneath the structure.
Volume has also been trending lower during the consolidation. I would love to see it dry out even more while price continues to tighten.
22,70$ remains the important level for me. I don't want to anticipate anything here. Ideally I want to see more contraction followed by a clean move through 22,70$ with volume finally expanding.
Still constructive, but no action from my side yet. A few more days of tightening wouldn't bother me.
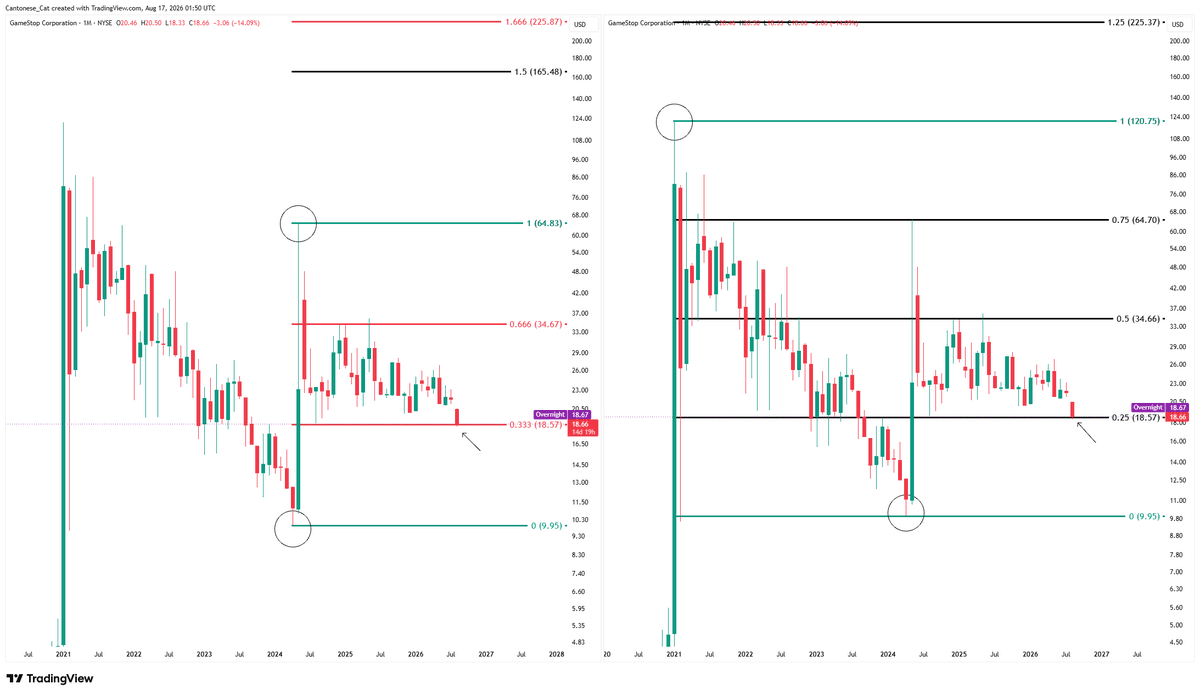
$GME is sitting at a very important level.
Look closely at the circles and how price reacted around these levels in the past.
Very interesting chart as usual from @cantonmeow.
Definitely worth paying attention to how $GME behaves around this area.
$HPE 12%, $SCZ 17%, $THEON 15% (weekly chart)
My 3 core positions for this Friday.
I won't add, trim or do anything today, just observe how we close this week.
I'm invested in 3 main themes:
HPE - Technology Hardware / Enterprise IT Infrastructure
SCZ - Metals & Mining
THEON - Aerospace & Defense
$GME (GameStop Corp. - Weekly Chart)
I've been thinking a lot about where GameStop actually stands today.
And IMO $GME is fundamentally in a much better position than it was a few years ago. The legacy business is still shrinking, but management has cut costs aggressively, improved margins and found real growth in collectibles, which surpassed 1B$ in FY2025 sales.
Q1 2026 was even more interesting, with revenue growing 14% YoY and GameStop generating 143M$ in operating income, compared with an operating loss one year earlier.
The thesis seems to increasingly be:
Profitable core business
Collectibles growth
Huge capital base
Ryan Cohen's ability to allocate that capital
And that last part is what still needs to be proven. Having billions available is great. Compounding those billions is what will create shareholder value.
The $EBAY situation could become an important part of that story, although personally I don't dislike a partnership instead of taking the risks associated with such a massive acquisition.
There are obviously big risks.
Dilution is real. The legacy business is declining, although collectibles have proven to be a major part of GameStop's strategy and further revenue creation. But as with a lot of trends, collectibles can also become something very cyclical.
Capital allocation is still largely unproven and the strategy is becoming increasingly complex. That's why I don't think $GME is automatically cheap just because of its balance sheet.
Short term, I'm also not bullish on the chart. If buyers don't step in, I still think 16,40$-16,50$ is a realistic possibility.
Longer term is where things get more interesting.
If collectibles continue growing, profitability becomes sustainable and Cohen proves he can compound GameStop's capital intelligently, today's valuation could eventually look very different.
The operational turnaround is real.
The profitability improvement is real.
The balance sheet transformation is real.
Now the next phase needs to be proven.
I'm much more interested in what $GME can actually become over the next 5-10 years, but that requires patience.
GameStop is what brought me to trading and I would love the story to be that GameStop was also a great position that eventually turned around my first bad buy. 😆
Since that period, I have learned so much about equity markets, charts, etc.
With what I know today, I would never have made such a purchase because that capital could have been compounding instead of being stuck in one position.
But you're always smarter afterwards, and what was a major position for me a few years ago is today more of a nostalgic position compared to the capital I have allocated to the markets.
It all started with a meme and might finish with a truly exceptional company turnaround. Let's see.
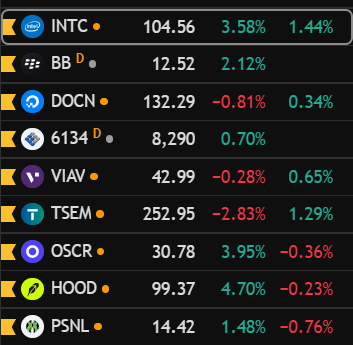
My current Golden Watchlist from strongest to weakest:
$INTC
$BB
$DOCN
$FUJI (6134)
$VIAV
$TSEM
$OSCR
$HOOD
$PSNL
I also keep a much larger general watchlist across different sectors, looking for potential new leaders and moving the best setups into my "Golden" Watchlist.
What I find interesting lately is how the list keeps evolving with the market. More and more potential leaders are starting to show up.
There are obviously plenty of other great stocks out there. $PLTR is a perfect example. But as a weekly chart trader, I want a structure where I can see a clear opportunity and eventually use the 4H chart to execute with manageable risk.
Until then, it stays on the general watchlist.
I try to find potential leaders. Scan 100s of weekly charts to filter them and then wait for the entry.