DXY on the verge of a bearish reversal - The Trump Effect 🚨
DXY has finally started to give bearish indications from HTF monthly supply and i think history is likely to repeat itself here, similar to trumps last term, where he wanted to weaken the dollar and is wanting to do the same again this term! With this in mind, the technicals are also aligning with this thesis as DXY looks more and more topped out as it hits crucial key levels and supply, giving breakdowns from the daily timeframes.
Its gave a 1,2 and 3 day bearish MS, confirming the monthly supply with this bearish breakdown. From here I want to see continued downside momentum into a weekly bearish MS as marked up on the chart with a body close below this level to really give HTF confirmation of this HTF reversal from supply, leading to a full bearish reversal in DXY and a changed macro outlook as EU, GU, AU all flip bullish on their HTF, fuelling a continued bullish phase in BTC as DXY breaks down with their inverse correlation they hold.
Id expect to see DXY target the SSL on the HTF range lows and come into HTF 6 month and 1 year demand ranges below this to act as key HTF reversal levels in the future. If we see the 1 weak bearish structure flip in DXY from here, its likely we start a new HTF downtrend in DXY for the foreseeable until it hits the SSL on the range lows as a minimum, which will result in a positive outlook for crypto.
Trump has also publicly stated he wants to weaken the dollar and did so in his last term too, where the dollar pulled a HTF bearish reversal putting in the high and starting a bear trend for the following 400 days after his entrance to office as you can see on the chart, taking the DXY straight into SSL 👁️. This only supports the HTF bearish reversal and thesis here and what im seeing on the charts!
Weakening of the dollar results in many benefits to the USA and global economy, overall:
Trump's push for a weaker dollar boosts U.S. exports, reduces the trade deficit, and makes debt easier to manage by inflating it away. It also drives stock market growth and attracts foreign investment into U.S. assets. However, it risks higher inflation and weaker purchasing power.
For crypto, a weaker dollar is typically bullish—investors seek alternative stores of value like Bitcoin and gold to hedge against currency devaluation. A falling USD also fuels liquidity into risk assets, driving higher speculation in crypto markets. If Trump weakens the dollar aggressively, BTC and alts could see significant upside.
Are you seeing the weakness in the dollar?
$DXY $BTC $ETH
$GME on $SOL: The Wyckoff Accumulation Range Continues to Unfold
GME on SOL continues to unfold in its Wyckoff accumulation range, now spanning 185 days.
It’s currently in phase C of the accumulation range development, and I’m looking for confirmation of price reclaiming the range low, taking support off the support lines and daily demand, and starting to form bullish orderflow.
That, to me, would signal my thesis is correct and that price is in the process of a HTF deviation and reversal from these lows.
Looking at the monthly, price has respected this accumulation range structure and has always rejected from the lows — just as it’s doing now. This could form a bullish pinbar close on the monthly from this low and reverse from here, aligning with the LTF if we get confirmations.
Note this: the HTF is aligning to the LTF here imo, giving strong confluence. The same applies to the 1W, 2W, and 3W charts — all show the range well defined, rejecting the range low and deviating over many months. There’s only so long this will go on before the cause has developed enough and the effect takes place as price reverses and moves higher.
And remember this: the longer the cause (development of the range), the greater the effect (the price movement that follows the cause). Reflect on price and think about where we could head if everything aligns as I’m forecasting and the narrative plays out as a whole.
For me, the targets are clear and always have been with this coin (and $AMC, $WSB, and $KITTY on SOL). I truly believe GME will smash a new ATH when the GME stock movement takes off (and it doesn’t seem too far away now!) and Roaring Kitty comes back on X. I think we’ll see an absolute melt-up in them all, with capital rotating between them all and the GME stock.
The way I see it, price is in this local accumulation range as marked. Once we break out of this, the target is the ATH at $230 million MC — and let’s be honest, price moved from $2.83 million to $150 million in 3 days after breaking out of its prior accumulation range spanning only 36 days. Think what could happen after ranging here for 185 days within this local accumulation range, sat inside a larger range from the low of August 2024 where price has ranged for over 400 days!
I think we see $500 million (a modest 2x) or maybe even $1 billion MC. I don’t think that’s out of the question if everything unfolds as I’ve discussed before — so imagine what AMC and WSB on SOL could also run to...
It’s funny, because GME on SOL has been the weakest pair of them all despite being the centre of it all. Is it a telling sign of manipulation during the accumulation phase? Who knows.
@Gmestopsol
1D:
https://t.co/50x0QDpiOD
https://t.co/9bTmeRFh3p
2D: https://t.co/TBm3xgTOul
3D: https://t.co/cPHSgNcJip
1W: https://t.co/XdczwlftZt
2W: https://t.co/mzd6arNiNs
3W: https://t.co/52WeFHpL87
1M: https://t.co/BDhdNEmiZE
The Calm Before the Breakout: GME & Friends Are Coiling
These SOL pairs — GME, AMC, WSB, and KITTY — look incredibly primed for a major upside move. All it takes now is for GME stock to start climbing and one post from Roaring Kitty to ignite the volatility.
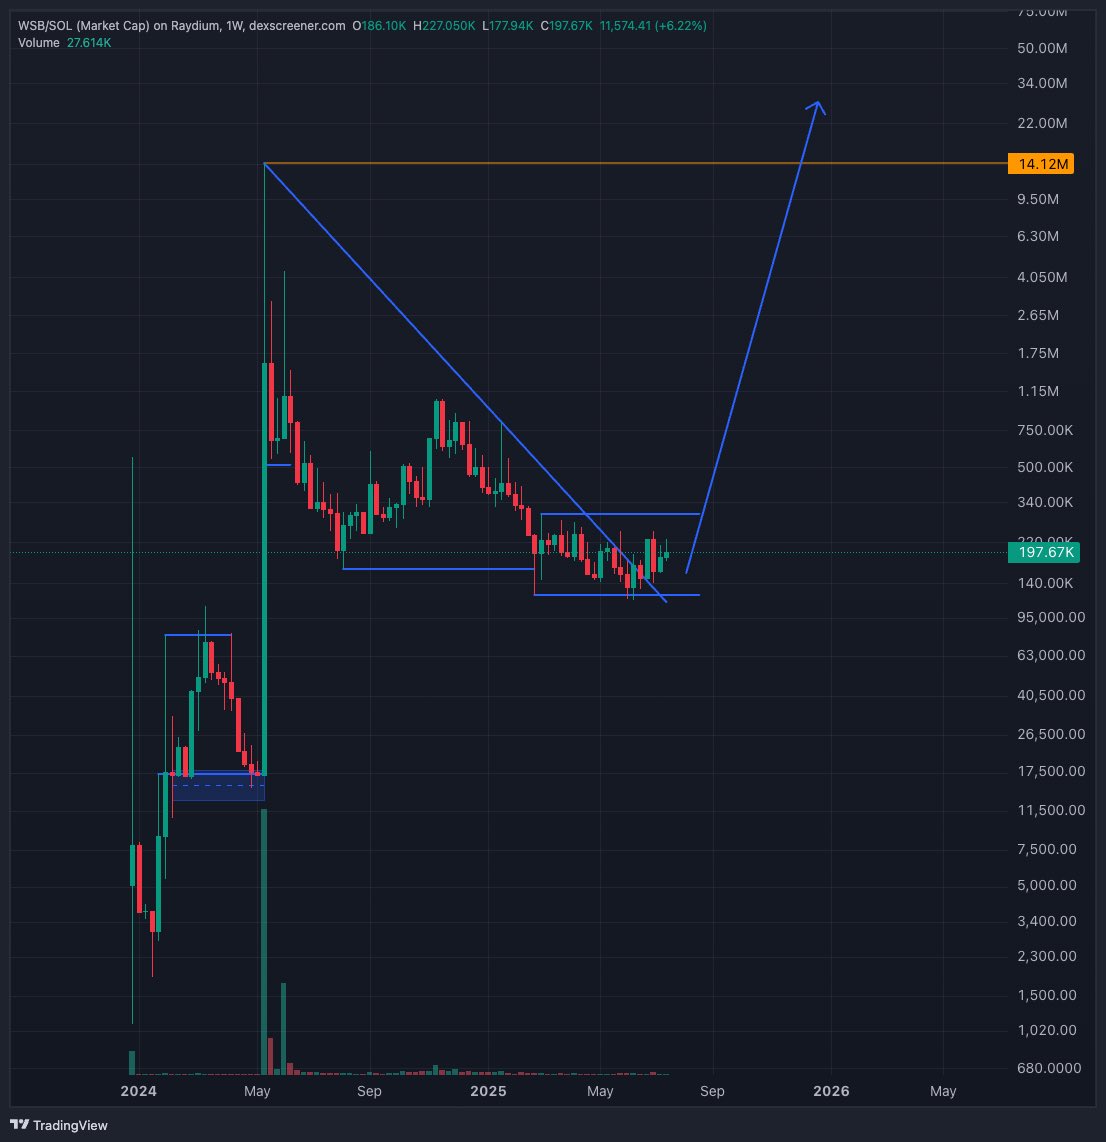
Each of these tokens has spent months in a local accumulation range, sitting beneath or around the August 2024 low. They've now broken out of their higher timeframe (HTF) downtrends, after sweeping the range lows and shifting bullish as they begin to push higher.
From a Wyckoff perspective, this setup is textbook. The narrative is aligned perfectly — GME’s potential next move, AMC’s stock rebound, and Roaring Kitty at the center of it all.
Look back at April 2024: GME ranged, swept the low and bottomed for just 36 days before exploding. In contrast, this current local range has held for nearly 130 days — more than triple the duration — forming a much deeper, longer accumulation at HTF discount prices.
That’s significant. The longer and deeper the base, the bigger the potential move. Once this breaks, it could absolutely send — and the other SOL pairs will likely follow.
Volume tells the same story. We've seen spikes as price swept the lows and manipulated the highs — signs of strong hands accumulating. But now, volume has cooled, and volatility is near dead. That’s classic behavior before the breakout.
Price has tested the range lows, flipped bullish, and is now coiling. It looks almost identical to the 2024 setup — sweep, shift, consolidate, then launch.
Watch for volume to erupt. This is shaping up to be the kind of breakout that prints a god candle.
@Gmestopsol@AMC0NSOL@WSBsol@RoaringKSol
$GME: https://t.co/SCVn0RgWZQ
https://t.co/N2o6PFJEXw
$AMC: https://t.co/Ckst1hUTG8
$KITTY: https://t.co/B43BjYWDkE
$WSB: https://t.co/hpuado7RiC
What started with a cheap laptop and noisy charts…
Now it’s a focused system built to study, trade, and grow every single day.
If you’re serious about this game, make your environment match your goals.
The edge is earned.
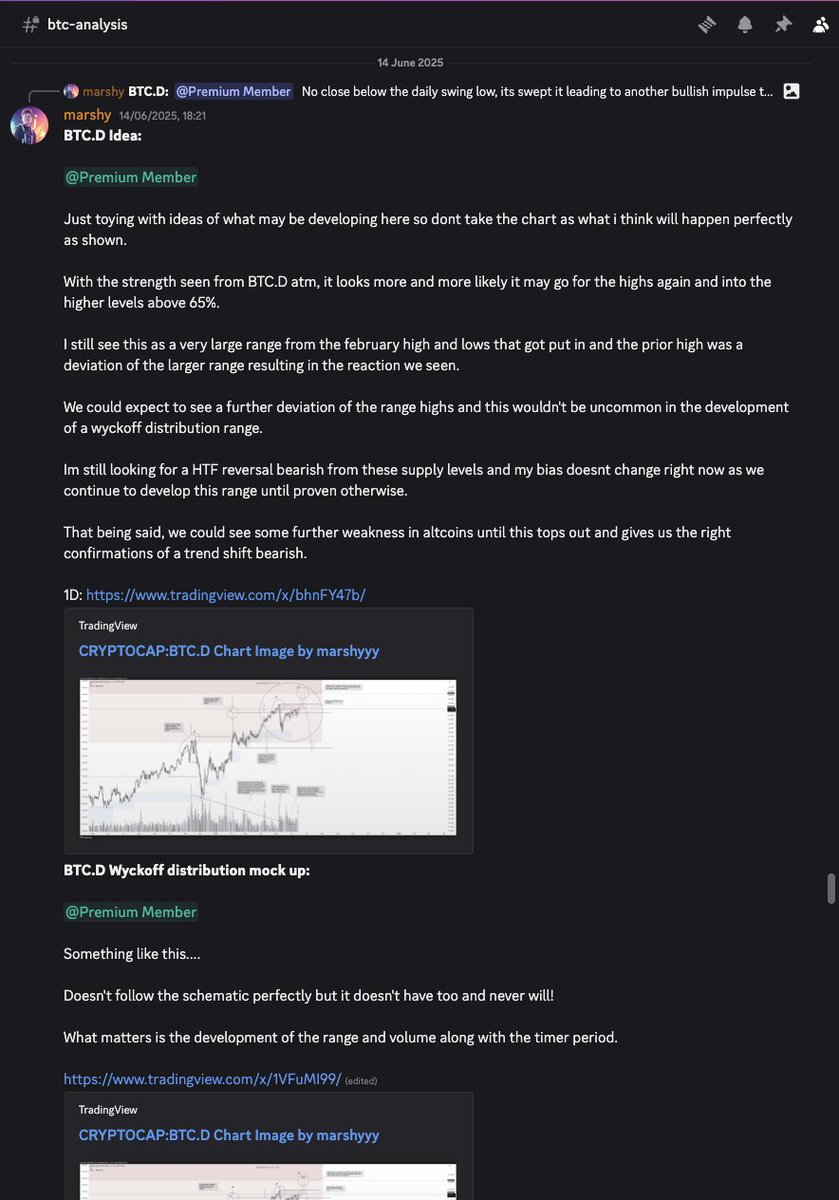
I absolutely nailed this $BTC.D forecast and top on June 14th🎯
Just look at the before and after charts using the same fractal as the BTC.D top of Jan 2021, its mirroring it almost perfectly right now.
The top is in for BTC.D, altcoin season is brewing and initiating more and more as this slips lower.
The final phase of the cycle is upon us!
@MaxBecauseBTC I agree Max.
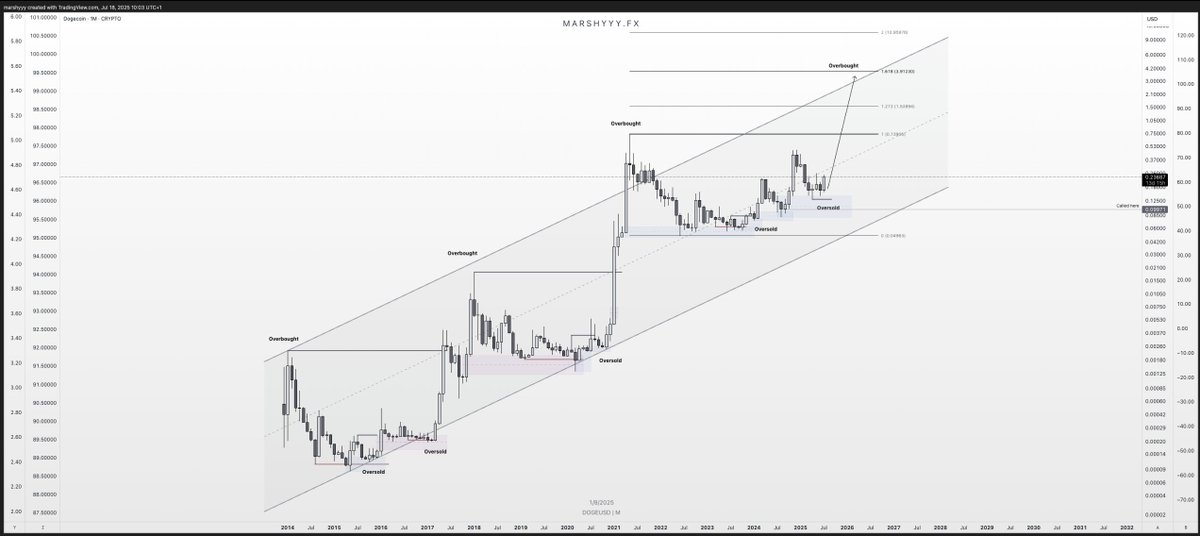
DOGE/BTC looks bottomed here and compressing hard in this multi year downtrend into support.
Only a matter of time
https://t.co/qxRgZZ3LFb
DOGE/BTC Update: HTF Retest Complete — Reversal Brewing
Diving into DOGE/BTC, we’re seeing strong bullish confluences that align well with the DOGE/USDT structure and support the idea that the macro low is in.
Looking back across all available data, DOGE/BTC has traded within a clear 7-year accumulation range dating back to 2014, bounded by a defined range high resistance and range low support. This long period of consolidation enabled massive accumulation, ultimately leading to the first breakout in 2021, which rejected at the highs, pulled back, and then exploded into a cycle ATH.
Since that 2021 high, DOGE/BTC has been in a 4-year downtrend, retracing back into discount pricing, right into the range high of that original accumulation zone — which now acts as a major HTF demand level and last point of support before the original breakout. 📷
What’s happened recently?
- Price swept 2024 swing lows (SSL),
- Tagged the HTF demand zone,
- Retested the 2021 breakout level (accumulation range high),
- Coiling inside a descending wedge with contracting volatility,
This entire region is a key reversal zone from both a structural and psychological standpoint. It’s where we typically see major trend shifts form, and the structure suggests we’re forming a HTF swing low and bottom from this area. 📷
Add this to the confluence from DOGE/USDT — which also appears to have printed its bottom — and the case for a macro reversal gets even stronger.
As this wedge tightens and price continues to compress against long-term support, I’m anticipating an explosive breakout that kickstarts the next leg of the HTF uptrend — effectively a continuation of the original breakout from the 7-year range.
$DOGE $BTC
@i_am_jackis Lovely analysis Jackis! $1 seems programmed, lets see what it gives us...
The reversal is playing out beautifully... just as DOGE/BTC hits some key levels too 👀
DOGE/BTC Update: HTF Retest Complete — Reversal Brewing
Diving into DOGE/BTC, we’re seeing strong bullish confluences that align well with the DOGE/USDT structure and support the idea that the macro low is in.
Looking back across all available data, DOGE/BTC has traded within a clear 7-year accumulation range dating back to 2014, bounded by a defined range high resistance and range low support. This long period of consolidation enabled massive accumulation, ultimately leading to the first breakout in 2021, which rejected at the highs, pulled back, and then exploded into a cycle ATH.
Since that 2021 high, DOGE/BTC has been in a 4-year downtrend, retracing back into discount pricing, right into the range high of that original accumulation zone — which now acts as a major HTF demand level and last point of support before the original breakout. 📷
What’s happened recently?
- Price swept 2024 swing lows (SSL),
- Tagged the HTF demand zone,
- Retested the 2021 breakout level (accumulation range high),
- Coiling inside a descending wedge with contracting volatility,
This entire region is a key reversal zone from both a structural and psychological standpoint. It’s where we typically see major trend shifts form, and the structure suggests we’re forming a HTF swing low and bottom from this area. 📷
Add this to the confluence from DOGE/USDT — which also appears to have printed its bottom — and the case for a macro reversal gets even stronger.
As this wedge tightens and price continues to compress against long-term support, I’m anticipating an explosive breakout that kickstarts the next leg of the HTF uptrend — effectively a continuation of the original breakout from the 7-year range.
$DOGE $BTC
Well when SOL/ETH looks like this, it’s safe to assume that ETH will continue to outperform for the time being.
Price has took major SSL and is drawing to key levels and demand and ain’t far off, so another flipping and SOL gaining strength ain’t far off either but we have a little more downside in SOL/ETH first imo
Nailed this $BTC.D forecast published June 14th on Tradingview…
BTC.D - Could it be Wyckoff Distribution Developing - #BTC.D TradingView https://t.co/aUaQY2eef7
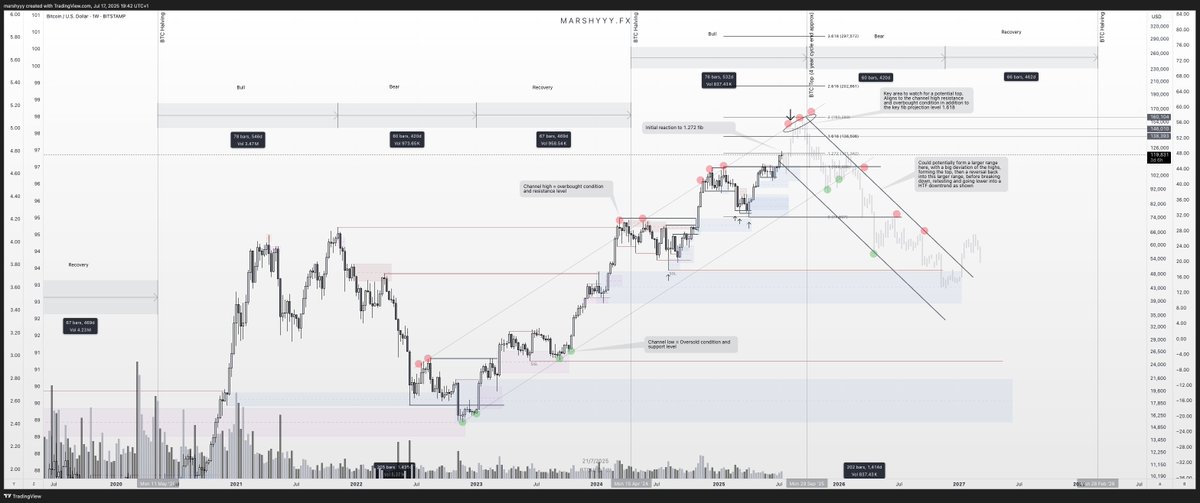
$BTC – Tracking the Top: 4-Year Cycle + HTF Channel Analysis
Been asked a few times lately where I think the top could form… so here’s what I’m looking at.
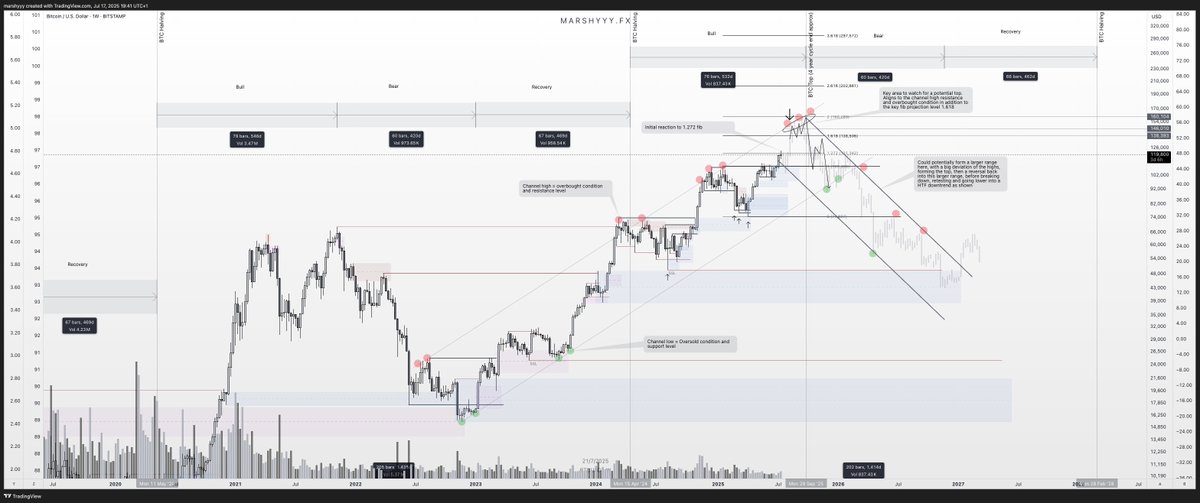
BTC is still following a clean HTF uptrend channel that’s guided price since early 2023. We’ve consistently bounced from the lower bound and rejected from the upper bound — respecting the channel across every major leg.
Right now, we’re in that final grind higher toward the upper bound again — which currently sits around $140K–$160K, depending how far it deviates. That range also lines up perfectly with the 1.618 fib projection from the prior leg.
We already hit the 1.272, where we saw the first rejection and cooling off. This next push up into the 1.618 + channel resistance is where I’ll be laser focused for a potential top forming.
It also aligns closely with the 4-year cycle theory, which has BTC topping out around September — give or take a few weeks or so. Combine that with key levels, high volume, momentum signals, and confluences on USDT.D, BTC.D, stablecoin ratios, and macro, and you’ve got a strong case for timing the exit.
This isn’t about guessing a candle.
It’s about recognising the process.
As always — the real edge comes from multiple charts aligning. USDT.D will be the final signal, but when all the confluences start stacking at HTF resistance, I’ll be reducing risk and locking in the win.
New ATHs likely still to come — but that’s exactly where the trap gets set.
Final leg.
Final phase.
Exit plan ready. 🔐
Hey bro, check out @AMC0NSOL $AMC @WSBsol $WSB and $KITTY. All on Sol, tracked exactly to the price movements of GME stock and when roaring kitty posts and they move in symmetry with insane upside potential.
Soon as GME stock is ready is move and roaring kitty posts again, these will fly with the underlying correlation 👀👁️
@DonnyDicey Same thoughts mate! It’s looking very likely we see the DXY pull a bearish reversal anytime now, With M2 supply increasing. It’s shaping up lovely!
https://t.co/1gU2Hqpimj
https://t.co/uGvSoj8Rb6
DXY on the verge of a bearish reversal - The Trump Effect 🚨
DXY has finally started to give bearish indications from HTF monthly supply and i think history is likely to repeat itself here, similar to trumps last term, where he wanted to weaken the dollar and is wanting to do the same again this term! With this in mind, the technicals are also aligning with this thesis as DXY looks more and more topped out as it hits crucial key levels and supply, giving breakdowns from the daily timeframes.
Its gave a 1,2 and 3 day bearish MS, confirming the monthly supply with this bearish breakdown. From here I want to see continued downside momentum into a weekly bearish MS as marked up on the chart with a body close below this level to really give HTF confirmation of this HTF reversal from supply, leading to a full bearish reversal in DXY and a changed macro outlook as EU, GU, AU all flip bullish on their HTF, fuelling a continued bullish phase in BTC as DXY breaks down with their inverse correlation they hold.
Id expect to see DXY target the SSL on the HTF range lows and come into HTF 6 month and 1 year demand ranges below this to act as key HTF reversal levels in the future. If we see the 1 weak bearish structure flip in DXY from here, its likely we start a new HTF downtrend in DXY for the foreseeable until it hits the SSL on the range lows as a minimum, which will result in a positive outlook for crypto.
Trump has also publicly stated he wants to weaken the dollar and did so in his last term too, where the dollar pulled a HTF bearish reversal putting in the high and starting a bear trend for the following 400 days after his entrance to office as you can see on the chart, taking the DXY straight into SSL 👁️. This only supports the HTF bearish reversal and thesis here and what im seeing on the charts!
Weakening of the dollar results in many benefits to the USA and global economy, overall:
Trump's push for a weaker dollar boosts U.S. exports, reduces the trade deficit, and makes debt easier to manage by inflating it away. It also drives stock market growth and attracts foreign investment into U.S. assets. However, it risks higher inflation and weaker purchasing power.
For crypto, a weaker dollar is typically bullish—investors seek alternative stores of value like Bitcoin and gold to hedge against currency devaluation. A falling USD also fuels liquidity into risk assets, driving higher speculation in crypto markets. If Trump weakens the dollar aggressively, BTC and alts could see significant upside.
Are you seeing the weakness in the dollar?
$DXY $BTC $ETH
The GME Play and Correlation 👁️
Following on from my Youtube video breakdown on this narrative and these pairs: https://t.co/qLhyjwdhLK, heres a clearer view of the correlation and what im anticipating.
What I am about to show you is just how correlated this narrative and these pairs are, so you can truly understand this correlation, the narrative taking place and how to profit from it.
The charts im showing show the correlation of liquidity being injected into the stocks and these $SOL pairs as Roaring Kitty posts on X. These are not his only posts but a select series of them which has had the most significant influence on price. You can see that as he posts, the SOL pairs expand aggressively to the upside resulting in 100s to 1000s of percent gains, and are all extremely time sensitive to one another and these X posts.
@AMC0NSOL@WSBsol@RoaringKSol
Here are the charts for GME and AMC stocks, with these @TheRoaringKitty X posts on:
$GME: https://t.co/DmCc5ApTD6
$AMC: https://t.co/8qU3KhzW9i
Now, here are the SOL pairs and charts:
GME: https://t.co/Qc2s8wxEh3
AMC: https://t.co/FOi0zpCtj8
$KITTY: https://t.co/w3VnouBkRt