Tercer trimestre en una imagen:
📈 Siete Magníficos: +11 %
📊 S&P 500: +2 %
📉 S&P 500 equiponderado: -2 %
📉 Russell 2000: -8 %
El índice está en máximos gracias a un puñado de empresas. El valor medio lo está pasando mal.
$OVV
✅Breakout Rel. Volumen Aprox 1.5
✅ Sector líder XLE - Energéticas
✅ Valoración interesante: P/E 18.18 Forward P/E 9.41 PEG 0.54
✅Crecimiento EPS Y/Y 57%
⚠️ La Doji de hoy me genera dudas en el breakout.
Pero bueno, no todo tiene que ser perfecto 😉
Toda una GARP
$MELI
Logró un record histórico al registrar 30 trimestres consecutivos con un crecimiento interanual de los ingresos netos (revenue) superior al 30%. Y a pesar de ello, la acción cae hoy -4.81%.
La reacción del mercado ante earnings es una ruleta rusa 🔪.
@HyenukChu De acuerdo, personalmente en Colombia mis buenas inversiones han sido aprovechando acciones golpedas que saliendo de zonas 4 o zonas 1. Y han sido grandes oportunidades.
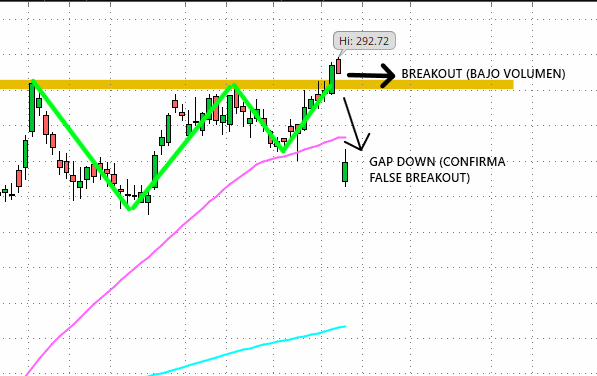
$DDOG - False breakout
Hace dos días, varias cuentas anunciaban haber entrado ante el breakout, decidí dejarla pasar por dos reglas que aplico:
No opero
1. Una acción en la víspera de earnings
2. Un breakout sin respaldo de volumen superior
Esto me ahorró una perdida innecesaria
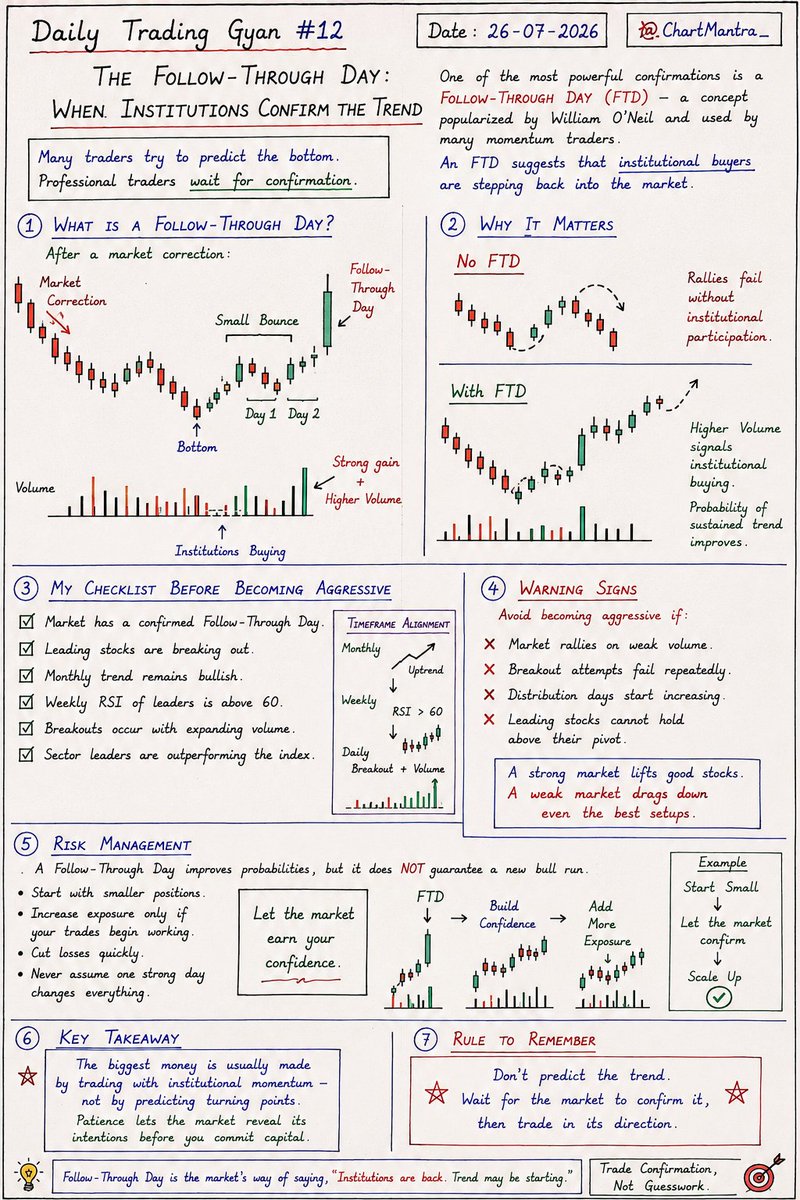
One of the most powerful concepts I learned from William O'Neil is the Follow-Through Day (FTD).
An FTD tells you one important thing:
Institutions are stepping back into the market.
Instead of trying to catch the exact bottom, I wait for the market to prove that buyers are in control.
My checklist before becoming aggressive:
✅ Follow-Through Day confirmed
✅ Leading stocks breaking out
✅ Monthly trend remains bullish
✅ Weekly RSI above 60
✅ Breakouts with expanding volume
✅ Sector leaders outperforming the index
🚫 Stay cautious when:
❌ Rallies happen on weak volume
❌ Breakouts fail repeatedly
❌ Distribution days increase
❌ Leaders can't hold above their pivot
📌 One lesson every trader should remember:
Don't increase your exposure because you're hopeful.
Increase it because the market is rewarding your trades.
Start small.
Build confidence.
Scale up only when the evidence supports it.
💬 Question for traders:
How do you know when it's time to become aggressive?
1️⃣ Follow-Through Day
2️⃣ Breakout success rate improves
3️⃣ Strong sector leadership
4️⃣ All of the above
👇 Share your answer in the comments.
❤️ Like • 🔁 Repost • 🔖 Bookmark this guide for the next market correction.
Follow @ChartMantra_ for daily trading notes, practical price action lessons, and high-probability swing trading strategies.
Want to Know If the Bottom Is In? Read this.
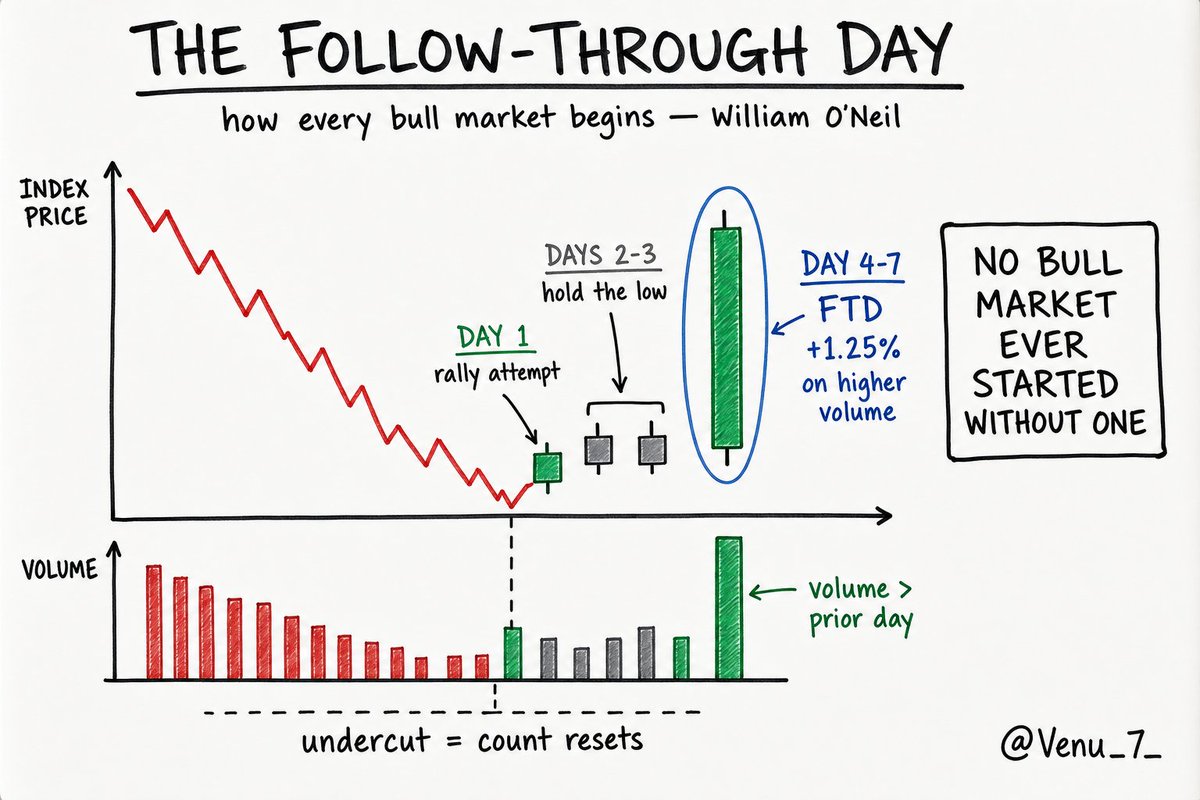
Since $QQQ just printed a gap-up candle, the next thing I'll be watching is the Follow-Through Day (FTD).
One of William O'Neil's most important rules for confirming a market bottom.
How it works:
- Market is in a correction. The first day an index closes higher = Day 1 of a rally attempt.
- Days 2-3 don't need to be up. The rally stays alive as long as Day 1's low holds.
- Then on Day 4-7, watch for one major index (S&P 500 or Nasdaq) to gain 1.25%+ on volume higher than the day before.
That's the follow-through day. Downtrend over. Confirmed uptrend.
The rules that matter:
- Not every FTD works - many fail
- But no bull market has EVER started without one.
- Undercut Day 1's low -> the count resets
- FTDs after Day 10 carry lower success rates
What to actually do on an FTD:
Don't go all in. Buy starter positions in leading stocks breaking out of sound bases. If the rally is real, they work - and you add. If it fails, you're barely exposed.
O'Neil's whole point: you don't predict bottoms. You confirm them.
Corrections are for building the watchlist. The FTD tells you when to use it.
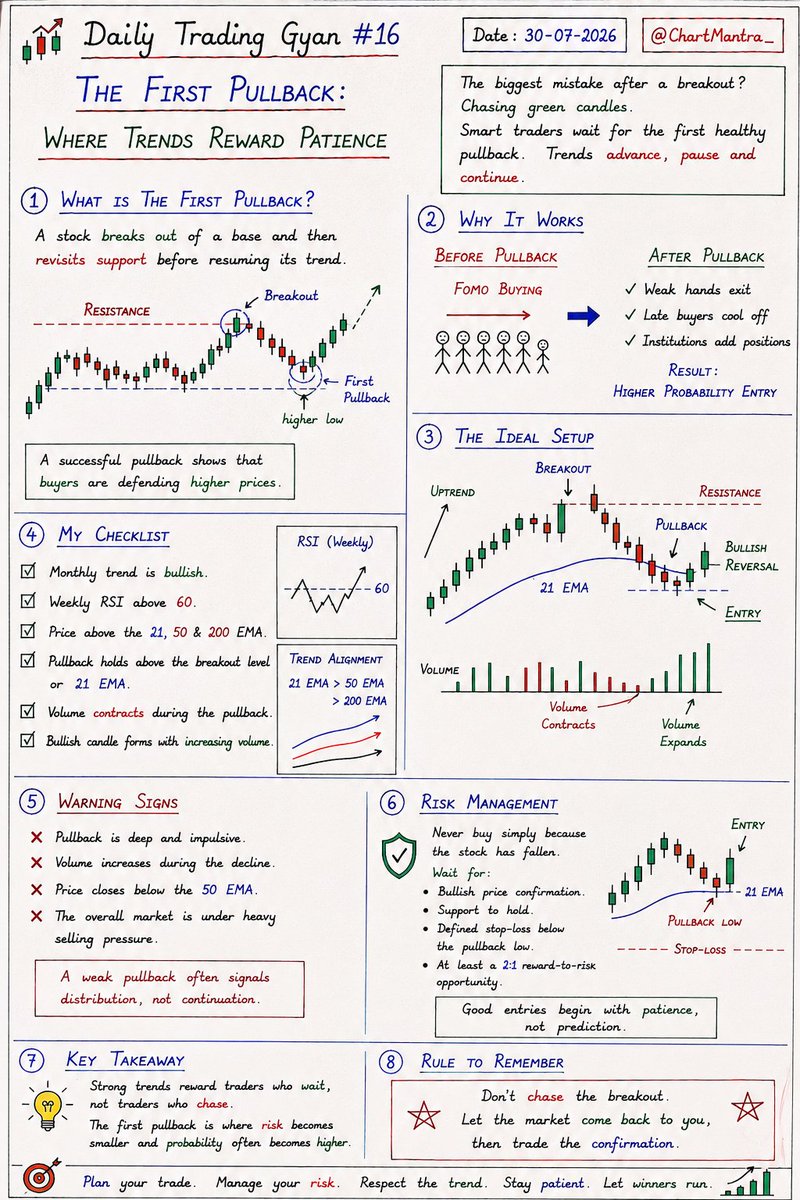
The best entries aren't made at the breakout. They're made after patience. 📈
The first pullback separates disciplined traders from emotional traders.
✅ Wait for the pullback.
✅ Watch volume contract.
✅ Enter only after bullish confirmation.
Trade with patience, not FOMO.
🔖 Bookmark this for your next swing trade.
Follow @ChartMantra_ for daily trading lessons.
The market gets quiet before it gets explosive. 📈
Most traders chase high volume.
Experienced traders watch for low volume.
Because when volume dries up while price holds firm…
…it often means the sellers are gone.
That's when a small increase in demand can lead to a powerful breakout.
My Volume Dry-Up (VDU) Checklist:
✅ Monthly trend is bullish
✅ Weekly RSI above 60
✅ Price above 21, 50 & 200 EMA
✅ Tight price action near support
✅ Volume at one of the lowest levels in weeks
✅ Breakout with strong volume expansion
🚫 Stay away if:
❌ Volume increases while price falls
❌ Wide, volatile candles appear during consolidation
❌ Price repeatedly loses the 21 EMA
❌ Volatility expands instead of contracts
📌 One trading lesson worth remembering:
High volume tells you when buyers are active.
Low volume tells you when sellers have disappeared.
Both matter.
The best setups happen when price stays strong while volume quietly fades.
❤️ Like • 🔁 Repost • 🔖 Bookmark this for your next chart review.
Follow @ChartMantra_ for daily trading notes, practical price action lessons, and high-probability swing trading strategies.
STOP SWING TRADING UNTIL THIS HAPPENS
Read this. Save this. You will need it to spot next time market consolidates EARLY.
It will save you thousands over the your lifetime.
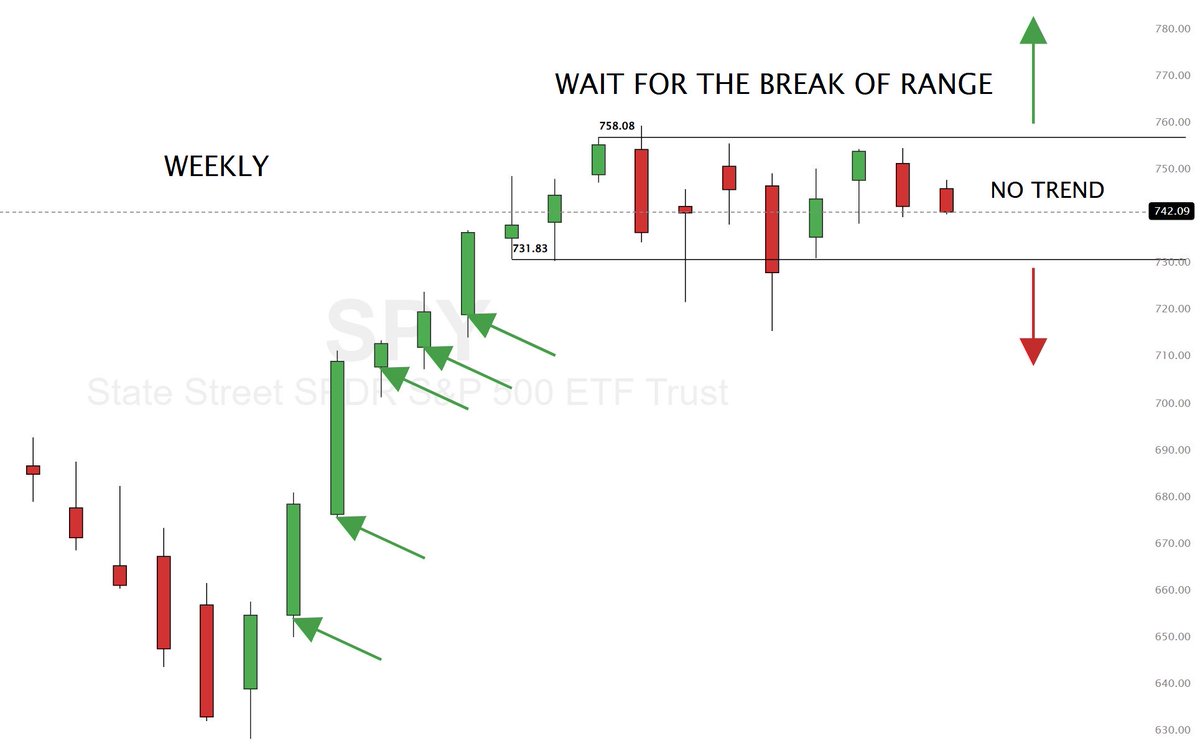
Before I decide how aggressive to be, I always check the $SPY Weekly chart.
Here’s my process:
• Strong weekly momentum → Stay aggressive.
• Weekly candles begin overlapping and printing inside weeks → Momentum is fading.
• That’s my signal to reduce position sizes, stop forcing new swing trades, and protect capital.
Wait:
• I wait for a break above the weekly range high or below the weekly range low.
• Once the range breaks, I start putting bigger money back to work.
The next trend always pays better than the chop.
Now you will be ready for any market condition.
Learned this rule on the floor 45 years ago and it still holds true 90% of the time (or so it seems): "If a stock does not trade into its GAP area the next 4 days, it can continue in the direction of the gap for 2 weeks. can see how this worked perfecetly the past two months on big blue!
I'm ok wirh whatever works for you; I don't argue with success. But for most using ATR, OB/OS oscillators, etc... my advice is to learn how to read charts and you won't need all the formulas and calculations. Indicators can only be coincident or lagging, so why not just go to the source?
Qullamaggie's 3 Timeless Setups Simplified
Kristjan Qullamaggie has made tens of millions trading 3 simple setups. These setups occurred last year, 10 years ago, 50 years ago, and 100+ years ago. They occur over and over again.
1. Breakouts
Big move higher in the past 1-3 months. Orderly pullback with higher lows. Range expansion out of that consolidation.
How to trade it:
Enter on opening range highs when the stock breaks out
Stop at lows of the day (not wider than ATR/ADR)
Sell 1/3 to 1/2 after 3-5 days, move stop to breakeven
Trail the rest with 10-day or 20-day moving average
In bullish markets, these can give you 10-20x+ your initial risk if you're good at setup selection.
2. Parabolic Short (or Long)
Stocks are like rubber bands. When they get stretched short-term, they snap back hard.
How to trade it:
Stock up 50-100%+ in days/weeks (larger cap) or 300-1000%+ (smaller cap)
Up 3-5+ days in a row
Short on opening range lows or wait for first crack and fail at VWAP
Target is 10-day and 20-day moving averages
5-10x risk/reward, but higher win rate than other setups
3. Episodic Pivot (EP)
When unexpected good news hits a neglected stock, it can trigger multi-month or multi-year moves. Usually earnings or guidance that surprises the market.
How to trade it:
Big move (or gap up) in price 10%+
Big volume (preferably average daily volume traded in first 15-30 minutes)
Big growth numbers with significant beat to analyst expectations
Best if the stock hasn't rallied in the past 3-6 months
Enter on opening range highs. Stop at lows of the day. Trail with 10-day or 20-day moving average.
The Key
All of these setups are about finding low-risk entries on fast-moving stocks. Tight, high-probability areas to enter. High risk/reward on trades.
You can be profitable with just a 25-30% win rate if you have small losses and big winners.
Qullamaggie built an Evernote database over 7-8 years tracking thousands of these setups. He went back decades on thousands of stocks to find recurring patterns.
That's the work. That's what it takes.
It’s clearly a challenging environment for breakout plays. A number of setups are failing before they even get the chance to move through their pivots.
Historically, September has been the worst month of the year for stocks, but we didn’t experience that seasonality this year. The bad news is we’re not out of the woods yet. Seasonally, October ranks as the third-worst month — nearly tied with February for second place. Caution advised.
Long-term SPY holders, stay the course. Pullbacks should be contained within the context of bull market.
Our $SPY Advisor Model remains on the May 8, 2024 buy signal.
November is a strong month and December the strongest of the year. That said, stock traders should always let the individual names guide you. No traction, no size. https://t.co/JXzFFTmMtn