Why Linhares Observatory exists:
In the short term, headlines move markets.
In the long term, structure defines direction.
Bitcoin is the signal.
Macro is the environment.
My analytical foundation was deeply influenced by Allan Raicher - one of Brazil’s early Bitcoin pioneers - who documented structure with rare discipline for years.
His work shaped how I observe cycles.
This page is not financial advice.
Not trade calls.
Not short-term signals.
Here you’ll find:
– Bitcoin as the core
– Macro as context
– Structural interpretation over noise
No hype.
No emotional trading.
No promises.
Only structure.
Only perspective.
Building clarity, one cycle at a time.
Welcome!
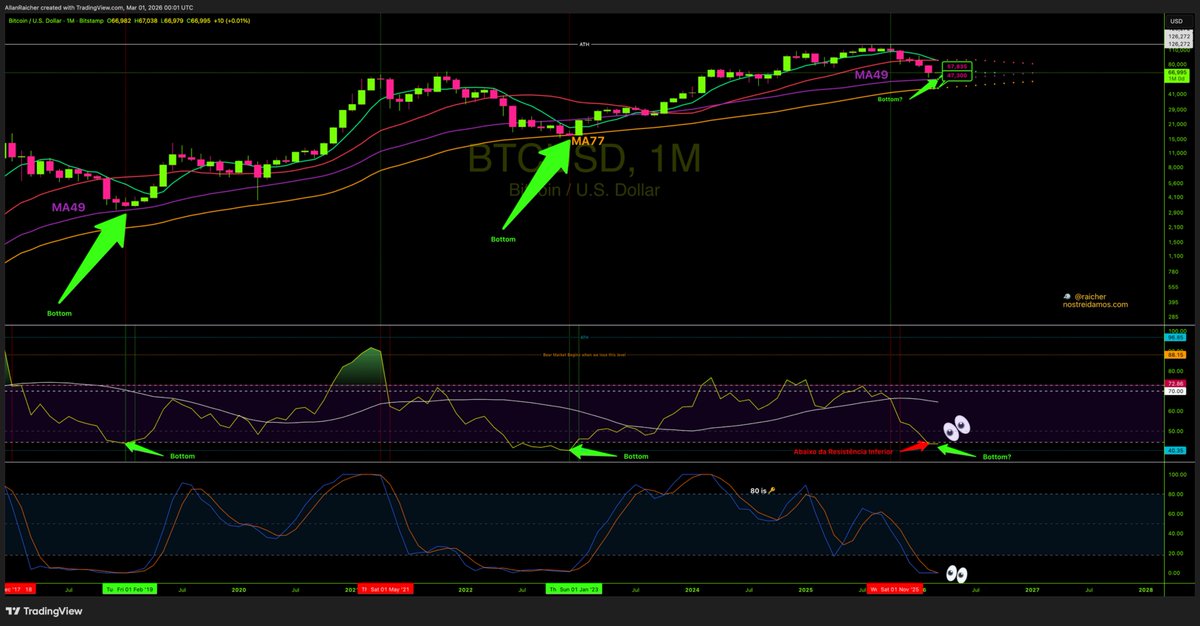
Vela de Março fechada!
- Vela fechou verde, porém com cara de Gravestone Doji o que é um sinal de alerta.
- RSI fechado nos 44.33, portanto AINDA ABAIXO da Resistência Inferior!
- Isso significa que ainda há potencial de procurar o fundo na MA49/77. MA49 está nos 58k e MA77 está nos 48k aproximadamente
#Mensal $BTCUSD
🔥
O pior é que quando a população finalmente perceber que o problema está na própria estrutura do dinheiro e que o Bitcoin oferece uma alternativa a isso, talvez já seja tarde para muitos acumularem de forma significativa. A história mostra que os ativos escassos sempre parecem “caros demais” até o momento em que passam a ser praticamente inacessíveis para a maioria.
@QuintenFrancois Excellent breakdown. People underestimate how much liquidity drives these moves. Price rarely goes where the narrative says it goes where the orders are. I’ve been noticing some interesting structure forming lately as well.
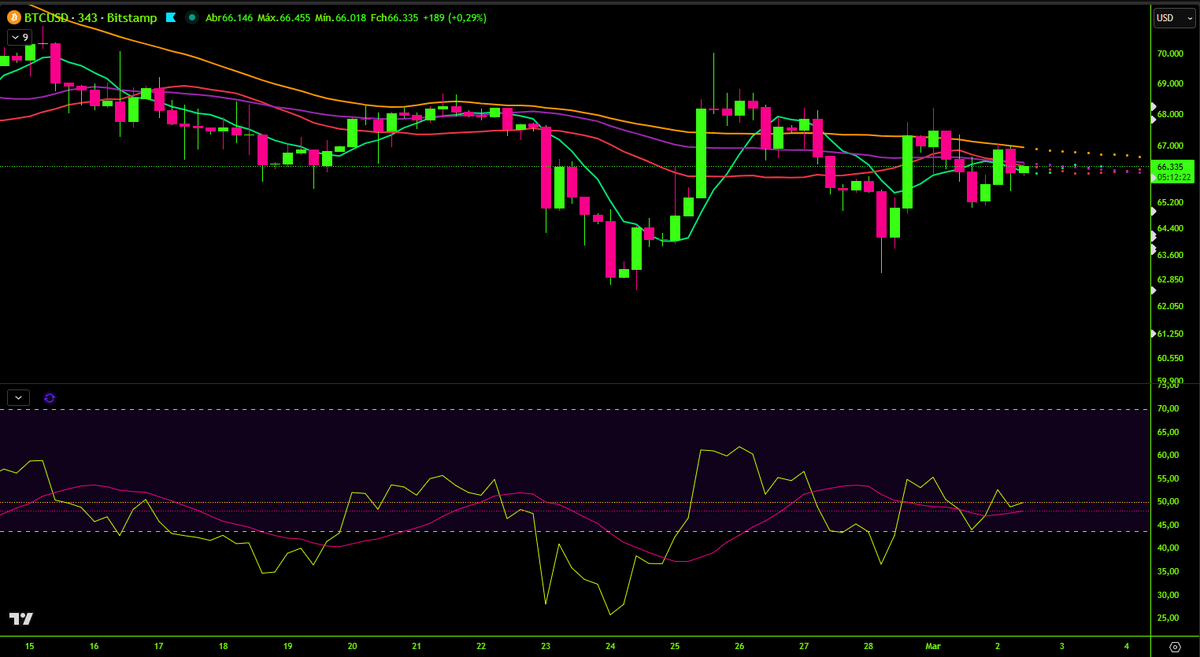
BTC – 343min Update
Price has finally broken a resistance that had been capping the market since early February.
After several failed attempts, the level was reclaimed with momentum, shifting short-term structure back to the upside.
The next major reference now sits at the MA231.
The last time BTC attempted to reclaim this level was January 28th around $90,438. That rejection was followed by a move that eventually led to a 30%+ drawdown.
That makes this level particularly important.
At the same time, RSI is approaching its upper resistance band, a level price has not been able to break since early January.
So the market is approaching a critical zone:
• Price reclaiming structure
• Major MA resistance ahead
• RSI nearing its ceiling
Momentum is improving, but the real test is still ahead.
If MA231 gets reclaimed, market structure shifts meaningfully.
If rejected again, volatility could return quickly.
Key levels are now coming into play.
Since the geopolitical event, what stands out is not the drop it’s the reaction.
On the 343min chart, despite the pressure, price has not lost the lower RSI support. It tested it. It held. It bounced.
That matters.
In truly weak structures, RSI breaks that support cleanly and accelerates downward. Here, we saw absorption instead.
Price remains below the MA77, which continues acting as dynamic resistance, but the market is building a base just beneath it typical compression behavior before expansion.
Current structure:
• Holding RSI lower support keeps the structure intact
• Reclaiming MA77 shifts short-term momentum
• Losing the 65K region opens the door to lower liquidity
Futures have reacted, volatility has picked up, but structurally BTC is holding better than many expected under this type of stress.
This isn’t impulsive weakness it’s a market in decision mode.
Compression leads to expansion.
Liquidity decides direction.
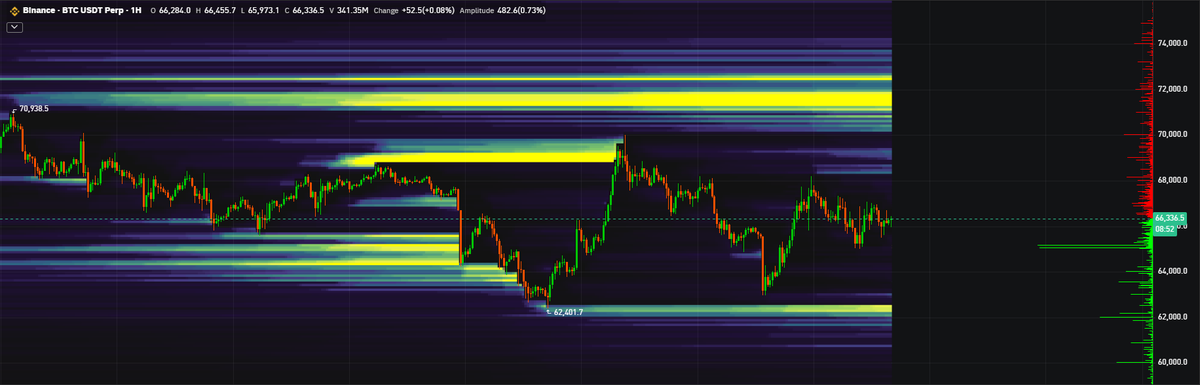
Looking at this heatmap, price currently sits in a clear volume cluster a zone where both buyers and sellers have been active repeatedly. That often creates a neutral accumulation pocket, where the market decides where the next big liquidity sweep will occur.
Below that, there’s significant bid density near ~65K which could be real support, or simply liquidity that’s been left for stops. Above, there’s a large concentration of offers in the low 70Ks. The market tends to travel to where liquidity resides, not where headlines want it to go.
Today is also the first international market open since the geopolitical event. Despite that, BTC has held up better than many expected for a period like this, which speaks to underlying demand even under stress.
I’ve seen a lot of talk about “huge correction once markets open.” Fair point, but Bitcoin often responds differently than the consensus believes it historically loves to move into liquidity and shake out expectations.
The question now is whether price resolves this accumulation toward the lower liquidity gap below or absorbs supply above. Both paths tell us something about the next phase.
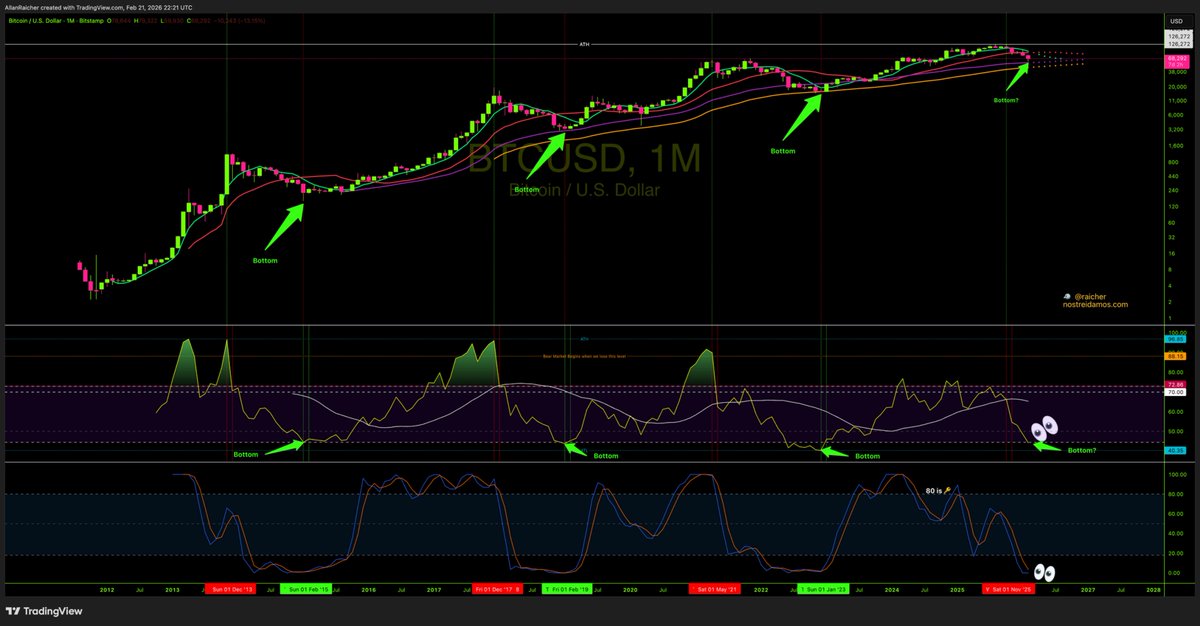
#Mensal FECHADO!
- ABAIXO da Resistência Inferior do RSI, portanto na região do RESET (finalmente).
Nessa região costumamos formar o fundo do bear market. O fundo sempre aparece ANTES do que todo mundo imagina.
- StochRSI com cara de cruzamento. Ainda pode lateralizar por 1 mês para confirmar fundo.
- MA49 ainda não foi testada. MA77 muito menos.
Vamos torcer para uma eventual correção tocar apenas a MA49.
Ainda temos o #Semanal para fechar, portanto a volatilidade pode começar a partir de amanhã.
Inflation really is regressive because the people closest to financial markets can protect themselves, while those holding only cash slowly lose purchasing power. Access is the real dividing line. The ability to hold scarce assets — whether equities, real estate, or Bitcoin — changes how inflation impacts you. Crypto doesn’t eliminate inflation, but it does lower the barrier to accessing a fixed monetary policy. In a world where balance sheets keep expanding, having the option to opt into scarcity is powerful. Economic freedom starts with monetary choice.
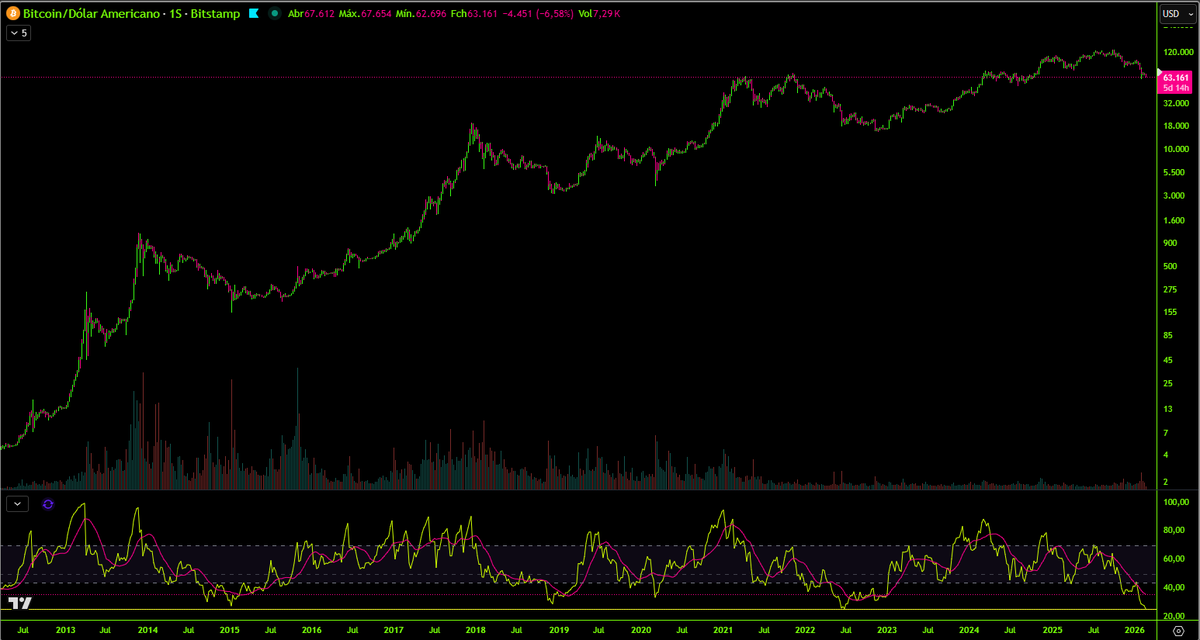
BTC Weekly RSI – Historical Context
On the weekly chart, BTC is now at one of the most oversold RSI levels in its entire history.
Only once before did we reach a similar extreme:
June 27, 2022.
What happened then?
Price continued lower briefly.
A final flush occurred.
But that zone ultimately marked the macro bottom of the move.
Important distinction:
Extreme weekly RSI doesn’t guarantee an immediate reversal.
It signals structural exhaustion.
In 2022:
– One more leg down followed
– Then a multi-month base
– Then a new expansion phase
History doesn’t repeat mechanically.
But extremes tend to matter.
We are at one of those extremes.
Belief is important.
But conviction is built on understanding.
Bitcoin is freedom — not because price goes up, but because it removes monetary gatekeepers.
Yes, volatility has been brutal.
But while headlines focus on drawdowns, large holders continue to accumulate.
Every major cycle has shaken out conviction before expanding.
Freedom assets aren’t meant to be comfortable.
They’re meant to be sovereign.
Structure over emotion.
BTC Higher Timeframes – Structural Levels
Zooming out to the monthly chart.
Price approached the 49MA — a moving average that has acted as dynamic support since October 2023 and had not been tested yet this cycle.
We came close.
A full support test is not ruled out.
The 49MA currently sits near $57,300.
At the same time, February is closing soon.
It is critical that price holds the lower RSI support — a structure that has not been broken since January 2023.
Loss of:
• Monthly RSI support
• Monthly 49MA support
would materially change the macro structure and increase the probability of a deeper bear phase.
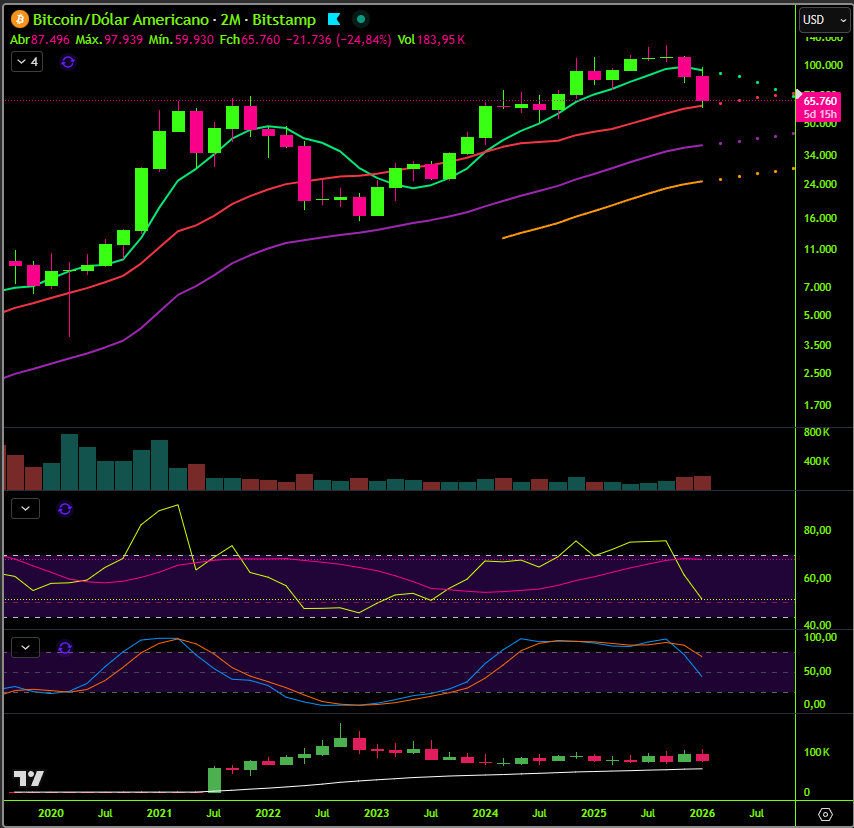
Now zoom to the 2-month chart:
A precise test of the 21MA support.
So far — clean reaction.
Higher timeframes are at inflection.
Structure defines outcome.
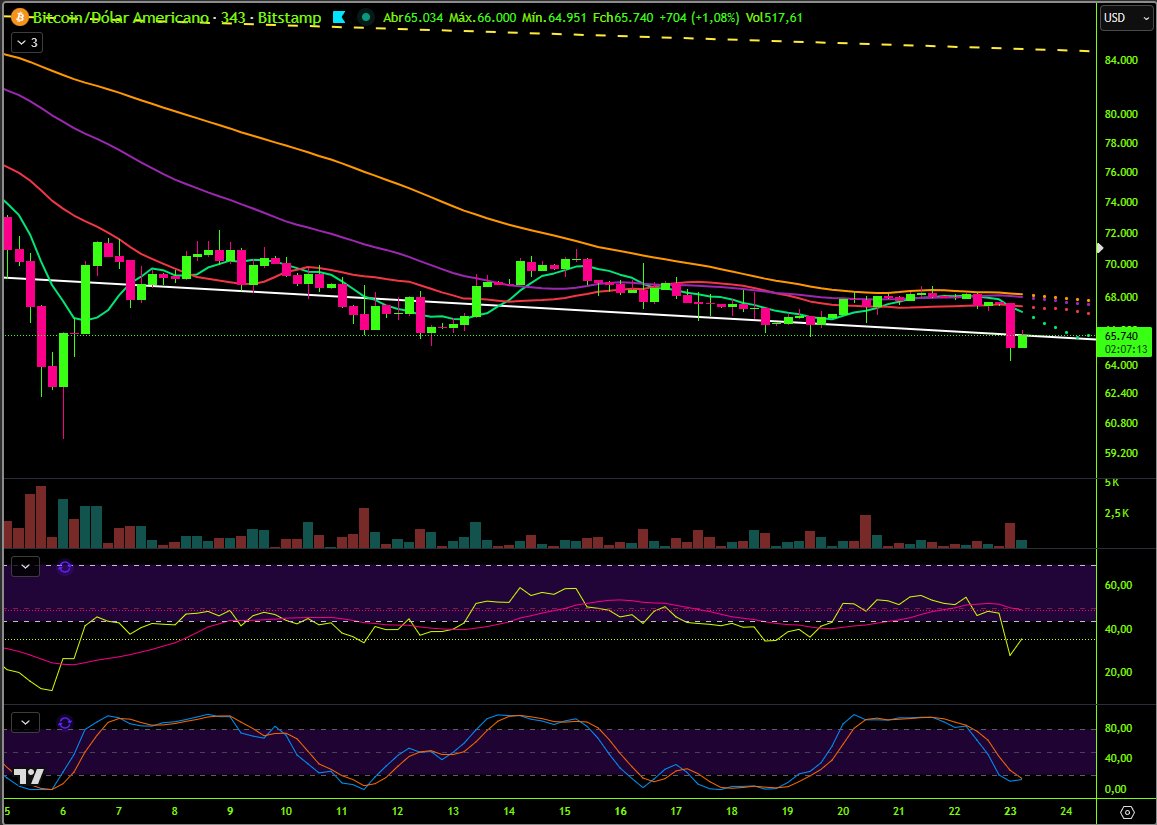
BTC 343min – Volatility Arrives
As previously noted, compression was unsustainable.
After multiple failed attempts to reclaim the 77MA, price rejected again and volatility expanded.
The squeeze resolved.
Now structure matters.
$65K becomes the immediate pivot.
If price stabilizes above it, this remains a volatility shakeout within range.
If $65K fails with acceptance below, the next liquidity pocket sits near $60K.
No emotions.
Just levels and reaction.
Volatility was expected.
Now we watch the response.
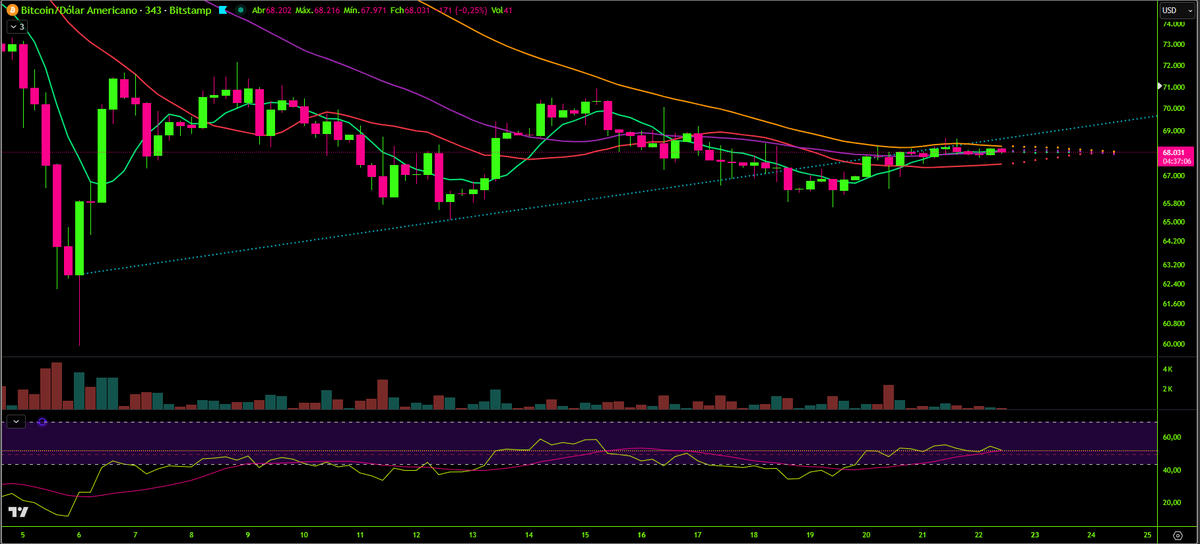
BTC 343min – Compression Update
Still trading below the 77MA.
Dynamic resistance remains intact.
Price is in maximum squeeze.
7/21/49 fully compressed.
Volatility contracted to cycle lows.
RSI has now met its moving average as well.
When price compresses under a declining 77MA while momentum flattens, expansion usually follows.
Direction is secondary.
Volatility is the setup.
Weekend liquidity remains thinner moves can accelerate quickly once compression breaks.
Structure first.
Patience required.
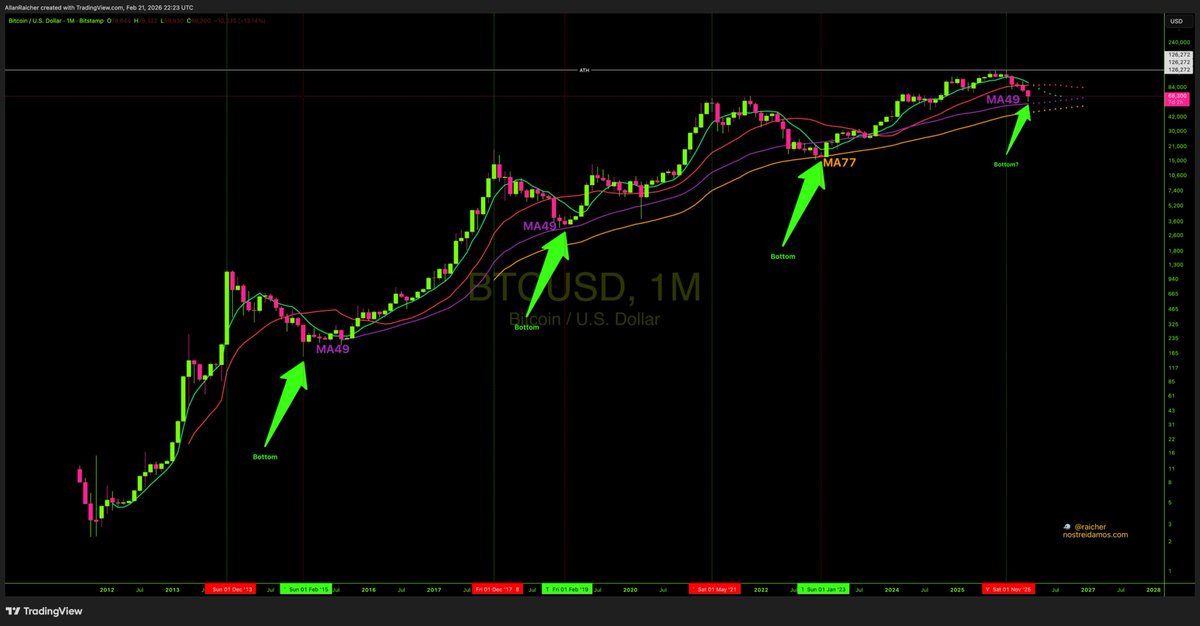
Vejam o RSI em vias de fechar SUB-44.5 que é o nível histórico de reset no intervalo Mensal.
Será que teremos um teste da resistência da MA7 (˜88K) em Março?
ou
Será que testaremos a MA77 (˜46K)?
$BTCUSD #Mensal a apenas 7 Dias de fechar para confirmar suporte na MA49 que foi o fundo de 2 Bear Markets, com exceção do último quando chegamos até a MA77.
Não descarto mais testes de suporte nessa média, mas vamos olhar bem para ela pois é importante.
If everyone believes price is going lower, then by definition someone structurally stronger is absorbing.
Markets don’t move on consensus.
They move on imbalance.
While ETFs have been distributing, on-chain large holders have been increasing exposure.
Supply is transferring not disappearing.
The question isn’t “who is buying?”
The question is “who can afford to wait?”
The real issue isn’t trade.
It’s monetary structure.
For decades, the global system has run on a dollar based credit expansion model.
That model allowed the U.S. to export currency and import goods.
If that cycle contracts, volatility increases - not just for the U.S., but globally.
The deeper question is:
What neutral settlement asset exists outside national monetary policy?
Bitcoin doesn’t solve trade imbalances.
It doesn’t fix geopolitics.
But it does introduce something new:
A globally auditable, non-sovereign monetary base.
In a world where fiat trust is increasingly questioned, neutral collateral becomes more relevant.