Paying for crypto signals? Explore Bitpool's free trade setups and market updates.
Read the reasoning, check the conditions and follow the updates.
Start here: https://t.co/gDgRNxunIl
Trading carries risk.
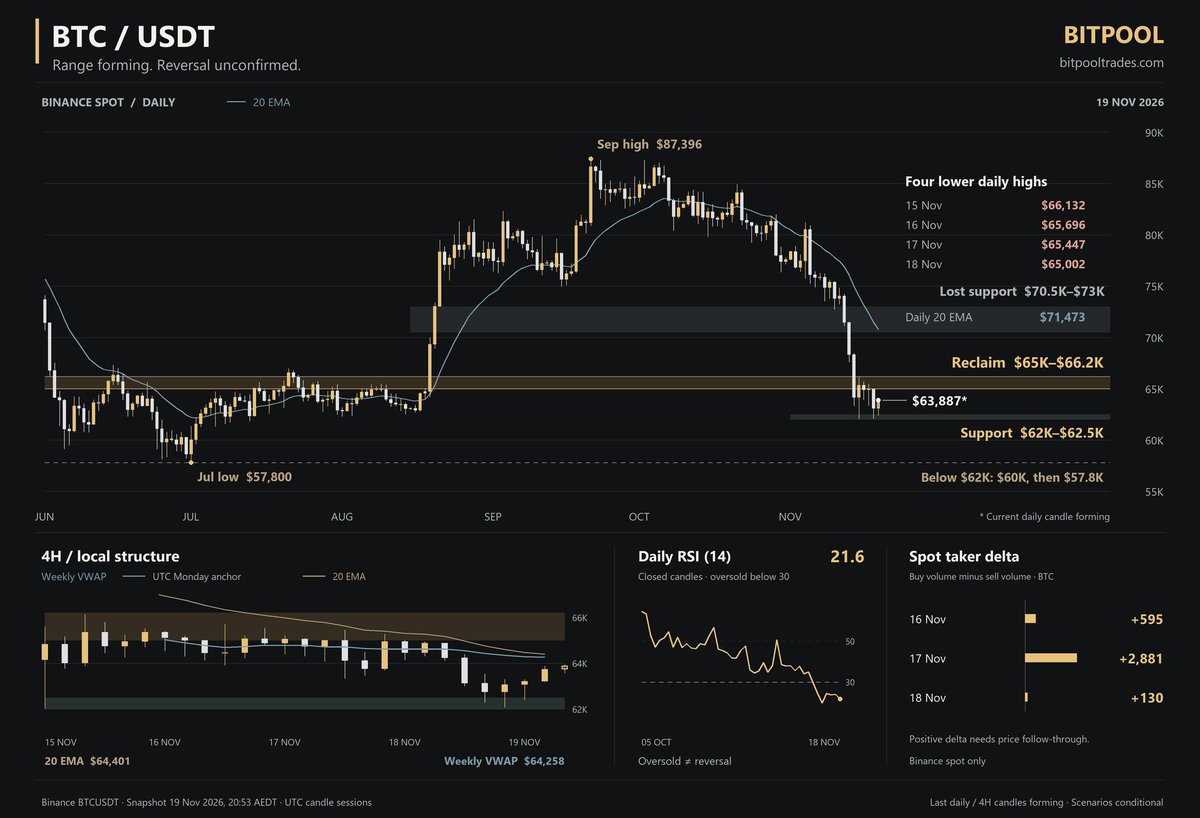
$BTC update | I’m still waiting on $65K
I’m still not convinced by this bounce. We’re back around $63.9K, but look at the last four daily highs: $66.1K, $65.7K, $65.4K and then $65K. Buyers keep trying, and each attempt is getting less distance.
That’s why I’m in no rush to add leverage here.
First, I want to see us get above $64.3K–$64.4K. We have the weekly VWAP and the 4H 20 EMA sitting together there. A 4H close above that area would get my attention. Then I want to see buyers hold it when price comes back.
$65K is still the daily close I’m waiting for. If we get that and hold the retest, I’ll start looking toward $66K–$66.2K. Getting rejected around these levels again would leave me expecting another test lower.
I’ve also been watching the spot buying. Binance had positive net taker delta over the last three completed days, including around +2,881 BTC on November 17. There are buyers stepping in, but we still closed the following day near $63K. I’d be much more encouraged if that buying was actually helping us hold higher prices.
And for anyone looking at the daily RSI near 22, yes, we’re oversold. I’m watching it too. But I need price to start holding support before I use that as a reason to long.
On the downside, keep $62K–$62.5K on your chart. If we sweep that area and quickly recover it, I’ll watch the next pullback for an entry. If we close below $62K and struggle to get back above it, I’m looking toward $60K, then the July low around $57.8K.
For now, I’m waiting. If you’re looking to add leverage, watch what happens on the retest before chasing the first green candle.
Free trade setups and market updates at https://t.co/uKv9FIXHUx.
This is the weakness I was talking about yesterday.
For spot accumulation, I like the zones we’re in. If you prefer to wait for confirmation, these are the two scenarios I’m watching:
• A daily close back above $65K.
• If $BTC drops below $57K, a daily close back above $58K before buying.
That’s how I’m approaching this: accumulate spot gradually, or wait for buyers to reclaim those levels.
$BTC is still struggling to hold above $65K, and I’m expecting another move lower before this market finds its footing.
The bounce hasn’t given me enough conviction to start adding leverage. My concern is that another wave of bad news could hit while price is still weak and trigger another selloff.
Don’t rush into leveraged longs here. I want to see buyers reclaim $65K, defend it on a pullback and follow through. Until then, I’m staying patient.
Free market updates at https://t.co/61TqffBae6.
@TheFoolCrypt USDT dominance has largely been driven by macro news. With more negative headlines around rate hikes potentially ahead, I don't see it coming down anytime soon. That said, I think the strong inverse correlation between BTC and USDT.D will start to weaken though.
$BTC is still struggling to hold above $65K, and I’m expecting another move lower before this market finds its footing.
The bounce hasn’t given me enough conviction to start adding leverage. My concern is that another wave of bad news could hit while price is still weak and trigger another selloff.
Don’t rush into leveraged longs here. I want to see buyers reclaim $65K, defend it on a pullback and follow through. Until then, I’m staying patient.
Free market updates at https://t.co/61TqffBae6.
$TAO long-term hold | Why I’m waiting for $108–$128
TAO bounced from $177.50 to a $195 daily close. What caught my attention was the next session. Buyers were still lifting offers on Binance spot, yet TAO closed lower at $191.90. Daily RSI had recovered from 26 on the selloff to just 32. That bounce did enough to relieve the selling pressure. It gave me little reason to move my bids up.
My buy range is $108–$128. February’s low at $142.80 is the level I’m watching on the way down. A bad headline could push TAO through that low and into my range. At $128, I’m $38 above my invalidation level. At the last daily close, that gap was roughly $102. I’ll wait for this one. If I miss it, I’ll focus on $ETH.
When I checked the Binance spot book, there was roughly $320K in bids between $108 and $128. Those orders can move before price gets there. What I want to see in the zone is sellers repeatedly hitting the bid, buyers replacing what gets filled, and each wave of selling pushing price a little less. If spot delta stays negative and TAO stops making fresh lows, that’s evidence buyers are absorbing the sell orders. A recovery above $128 that holds on the next pullback would give me conviction to add.
Once I’m in, I’ll exit on a daily close below $90. An intraday wick through $90 that recovers by the close keeps the position open.
I’m holding for a move above $400. September’s rally stalled near $341, well below the March high of $378. Clearing $341 would break that sequence of lower highs. The bigger test is whether buyers can take $378 and defend it from above. If they do, $400 is only about 6% higher. That’s the part of the move I want to hold for.
Free trade setups and market updates at https://t.co/61TqffBae6.
I said I’d come back after the weekly close. $BTC closed at $65,351, down 12.7% on the week. I expected buyers to defend $70.5K–$73K. They lost that whole zone, and Sunday’s bounce from $62,006 still left BTC well below it.
$60K is the level I’m watching inside the $62K–$59K zone. In February, BTC touched $60,000 and closed that same day above $70K. In July, it traded as low as $57,800 before finishing the day back above $60K. Same level, two very different days for anyone who bought the first touch.
This week, I’m looking for $BTC to sweep into $62K–$59K and close the day above $60K. If buyers then hold $60K on a retest, that’s where I’d look for a long toward $70K, the middle of the range.
If BTC closes below $60K and the next bounce stalls there, I’ll pass on the long. The July low at $57.8K would be back in play.
Free trade setups and market updates at https://t.co/61TqffBae6.
Bitcoin Weekly Outlook | I Expect a Bounce First, Then One Final Drop
I expect $BTC to rally into $79K–$80.5K this week. From the mid-$70Ks, I’d expect some shorts to take profit and buy back into the market. That gives BTC room to bounce toward $80.5K, the old range floor. That’s where I expect sellers to step back in.
My read is that we’ll see another round of war-related headlines. I think the timing matters here. A rally into resistance first would draw in fresh longs. If an escalation hits while those traders are leaning the wrong way, their exits could make the selloff sharper. I expect crude to move higher on renewed supply fears, and we’re already long oil on that thesis.
For BTC, I’m looking for that rejection to take us into $70.5K–$73K. I think that’s the final drop of this correction before the next leg up. It’s the area the August rally broke out from, and I expect buyers to defend it again.
What I want to see there is a dip into the zone, a daily close back above $73K, then a higher low on the next pullback. That’s where I’d look to get long for a move back through $80.5K.
Free charts and market updates at https://t.co/S54bTgHgCK.
I got $BTC wrong this month. I thought we were early in a bull market, and a drop this sharp caught me off guard. Even looking back, I can’t point to a signal that would’ve changed my call.
I’m waiting for the weekly candle to close. I’ll share my updated outlook then.
Bitcoin Weekly Outlook | I Expect a Bounce First, Then One Final Drop
I expect $BTC to rally into $79K–$80.5K this week. From the mid-$70Ks, I’d expect some shorts to take profit and buy back into the market. That gives BTC room to bounce toward $80.5K, the old range floor. That’s where I expect sellers to step back in.
My read is that we’ll see another round of war-related headlines. I think the timing matters here. A rally into resistance first would draw in fresh longs. If an escalation hits while those traders are leaning the wrong way, their exits could make the selloff sharper. I expect crude to move higher on renewed supply fears, and we’re already long oil on that thesis.
For BTC, I’m looking for that rejection to take us into $70.5K–$73K. I think that’s the final drop of this correction before the next leg up. It’s the area the August rally broke out from, and I expect buyers to defend it again.
What I want to see there is a dip into the zone, a daily close back above $73K, then a higher low on the next pullback. That’s where I’d look to get long for a move back through $80.5K.
Free charts and market updates at https://t.co/S54bTgHgCK.
$CRCL | I’ve waited all year to buy Circle. Today I’m finally buying.
My entry is $63.90. I wanted to buy Circle close enough to the summer lows that I’d know exactly where I was wrong. The higher-timeframe Shark put in a low in July. Now the smaller Bat has brought price back to that same area, with its completion zone right on the support line I’ve been watching.
On November 12, sellers pushed CRCL down to $62.77, but it closed at $63.82. That’s enough for me to start buying here. My stop is $56, below the Bat’s X low at $57.84.
$81.48 is where I’ll judge the bounce. That level gave way in October. I want to see CRCL close a day back above it, then hold it when sellers test it again. If buyers can do that, I’m watching the September highs near $100, followed by the May high at $140.
My take-profit is $160. From $63.90, I’m risking $7.90 per share for $96.10 of potential upside, roughly 12.2R before costs.
The bigger level on my chart is $203.84. That would retrace 61.8% of the decline from the all-time high and bring CRCL close to the daily volume imbalance and balanced price range. I’ll reassess that move after taking profit at $160.
Free trade setups and market updates at https://t.co/61TqffBae6.
$BTC scalp long | Watching the $72.7K low
BTC was trading at $73,489 at 21:22 Sydney time on November 12. The setup was still pending. I’m watching for price to sweep the November 10 low into or through $72,572–$72,691, then close a 15-minute candle back above $72,692. A retest that holds would show buyers have taken that level back.
$73,870 is the first test on the bounce. If buyers reclaim it and hold it as support, I’m looking for $74,905.1. The stop is $72,137.8. From the chart’s $72,692 reference entry, that’s approximately 4R before fees.
Free trade setups and market updates at https://t.co/61TqffBae6.
$XMR | My $470–$500 buy zone for a long-term move to $940
Buyers have defended almost the same price twice. On September 3, XMR traded down to $482.15 and closed the day at $520.83. On October 9, it touched $483 and closed at $518.66. Both times, sellers pushed below $500 and couldn’t keep it there by the daily close.
XMR was around $555 when I marked the chart. I’m willing to let the first bounce go and build a position if price comes back into $470–$500. On that retest, I want to see how quickly buyers recover $500. A close back above it that day would look like the last two defenses. Several daily closes inside the zone would tell me buyers are taking longer to absorb the selling.
My stop is a 4-hour close below $420. On the upside, the level I care about most is the January high at $799.89. That’s where the last major rally reversed. If XMR breaks $800 and buyers defend it on a pullback, I’ll be looking for the next leg toward my $940 take-profit.
Free trade setups and market updates at https://t.co/uKv9FIXHUx.
$ETH | My $1,800–$2,060 accumulation plan for a $5,800 target
I’m looking to build an ETH position between $1,800 and $2,060. What matters to me on this pullback is how ETH behaves the next time Bitcoin sells off.
From the November 4 close to the November 10 close, ETH fell 15.3% while BTC fell 8.3%. ETH also lost 7.6% against BTC over those six days. That’s why I’m willing to start buying around $2,060 while keeping room to add deeper in the range. A move from $2,060 to $1,800 is another 12.6% drawdown, even with price still inside my planned entry zone.
Here’s what would give me conviction to add: on the next sell-off, I want to see whether BTC can make a fresh low while ETH holds above $1,800 and ETH/BTC forms a higher low above 0.02752, its November 10 low. That would be the first sign that ETH is holding up better under the same selling pressure. If ETH bounces in dollars while it keeps making new lows against BTC, I’ll stay patient with the rest of the position.
My 12-month take-profit is $5,800. That’s roughly 17% above the previous Binance spot high of $4,956.78, so this trade depends on ETH eventually breaking into new highs. The early evidence I’m looking for is buyers defending this range even on a weak day for Bitcoin.
Free trade setups and market updates at https://t.co/uKv9FIXHUx.
Can $NEAR hold a higher low on the next pullback? That’s what I’m watching on the weekly chart.
See the levels I’m watching, what would change my mind, and all our other trade setups with a free Bitpool account.
https://t.co/mVovC8sw1K
$AVAX swing long | Accumulating the $7.90–$8.58 retest
Our plan is to build a long between $7.90 and $8.58. This is where the September breakout started. AVAX had spent weeks struggling to hold $8. Once buyers cleared that area, price ran to $12. Now I’m watching whether that former resistance can hold as support.
The November 8 daily candle is why I’m interested here. Sellers pushed AVAX down to $7.763, but it closed at $7.938, just back inside our zone. Buyers defended the lower edge that day. What I want to see next is a daily close above $8.58, followed by a pullback that holds it. That would give me more conviction in a move back toward the $11–$12 highs.
That $11–$12 area is the first real test. Sellers turned price away there in September and October. For the larger move toward $23.913, I want to see AVAX clear $12 and hold it as support. My stop for this swing is $6.293.
Accumulation $7.90–$8.58 · Stop $6.293 · Swing target $23.913
Free trade setups and market updates at https://t.co/uKv9FIXHUx.
$BTC 4H outlook | The level I want back is $75,000
BTC was trading at $74,679 when I marked this chart, just below the $75K floor of the range. My view: I still expect a bounce toward $79K–$80.5K, but I want to see buyers take back $75K before I trust it.
The key detail is that BTC has already swept $73,468. That wick tells me buyers stepped in once. The next test is whether they can push price back inside the range and keep it there. A 4H close above $75K, followed by a pullback that holds $75K as support, is the sequence I’m looking for. From there, $80.5K is the first serious test. That’s where the last sharp rally ran into sellers.
If BTC loses $74,000 again, I’ll be watching how it trades through that $73,468 low. If bids don’t show up there, my next level is $72,468. What would get my attention is a flush into that area, a quick recovery above the prior low, and then a reclaim of $75K. That would tell me more about demand than a touch of $72,468 alone.
For the bigger swing, I’m keeping $87.4K separate from the bounce trade. That’s the range high. I’d want to see BTC clear it and hold it on a retest before I start looking toward $93.5K. For now, the trade hinges on what buyers do at $75K.
Free trade setups and market updates: https://t.co/uKv9FIXHUx