I spent the last 5years studying ICT concepts.
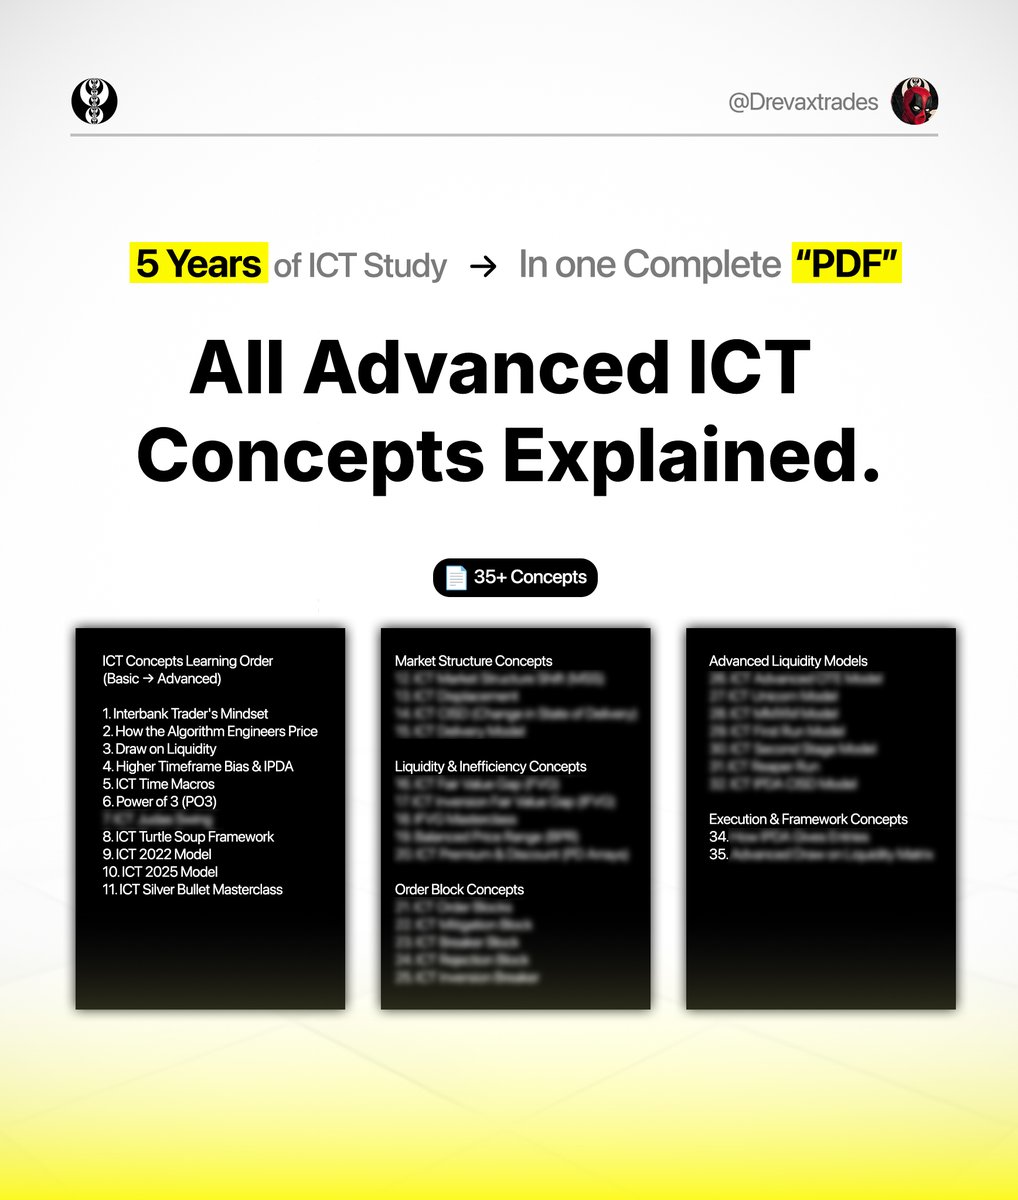
I compiled my notes into a structured guide covering 35+ advanced ICT concepts in the correct learning order.
I could’ve sold this as a course or ebook - but I’m giving it away for FREE.
Want the PDF?
• Like
• Repost
• Follow
• Comment “ICT”
I’ll DM it to you.
this 4-step system made my student $148,000 in 9 months
he was mass-failing prop challenges before this
now he manages $750k in funded capital
here's the exact framework:
STEP 1: IDENTIFY THE DAILY CANDLE BIAS (5 min)
open daily chart
ask ONE question: is today a CONTINUATION or REVERSAL day?
continuation signs:
- previous candle closed strong (near high/low)
- no major levels nearby
- trend is clear
reversal signs:
- previous candle has big wick
- price swept a major level
- extended from fair value (big gap below/above)
if you can't tell → no trade today
STEP 2: FIND THE LIQUIDITY (3 min)
mark two things:
EXTERNAL (where stops are):
- previous day high
- previous day low
- any obvious equal highs/lows
INTERNAL (where price wants to go):
- unfilled fair value gaps
- untested order blocks
price will sweep external THEN fill internal
that's the entire map
STEP 3: WAIT FOR THE SWEEP (patience)
do NOT enter until external liquidity is taken
this is where 90% of traders fail
they see price "approaching" a level and jump in early
wrong.
wait for the SWEEP:
- price goes THROUGH the level
- stops get hit
- THEN reverses
the sweep IS your confirmation
no sweep = no trade
STEP 4: ENTER ON THE LOWER TIMEFRAME STRUCTURE (2 min)
after the sweep, drop to 5m or 15m
wait for structure shift:
- market structure break
- displacement candle
- lower timeframe FVG forms
enter on the retest of that FVG
stop above/below the sweep
target the internal liquidity you marked
R:R is usually 2-4:1
THAT'S IT:
1. daily bias (continuation or reversal?)
2. mark the liquidity (external and internal)
3. wait for sweep (patience)
4. enter on LTF structure (execution)
my student went from:
- 12 failed challenges
- -$8,400 in challenge fees
- "thinking about quitting"
to:
- 5 funded accounts
- $147k withdrawn in 9 months
- "I can't believe it's this simple"
it's not complicated.
it's just not what YouTube teaches.
Here is your chance to retire this year with the least effort...
Come here daily and use whatever you think I rebranded, use it's supposed original name and who authored it and show the beforehand levels and where it will trade to.
Come here... tweeting directly at me where everyone can see it and I "can't hide". :)
If you expose me as a rebranding guru I will wire you a cool million dollars.
Come prove your lies boys.
do not be the guy who finally gets a day off and wastes it staring at the wall. be the man who uses his time to build the life he wants:
he wakes up early and his mind is already full
work tasks. family needs. messages. deadlines. there is always something
from the outside, he looks like everyone else. busy. responsible. tired
BUT HE HAS A DREAM
not a vague wish. a real thing he wants to build. something he wants to make true
his mission is crystal clear
so he sets goals. clear ones. he breaks them into steps. he builds a strategy that he can follow even on hard days
he protects his time. he shows up when it is not convenient. he puts care into the details. he obsesses over quality. not for praise. not for likes. because it matters to him
no one sees most of the work
they do not see the late nights. the early mornings. the quiet sacrifices. the times he says no. the times he keeps going anyway.
AND HE IS FINE WITH THAT
because he knows why he is doing it. and he gives his best
even if it never gets big, he still wins
because he can look at himself and say, I did not quit.
WHY NOT YOU?
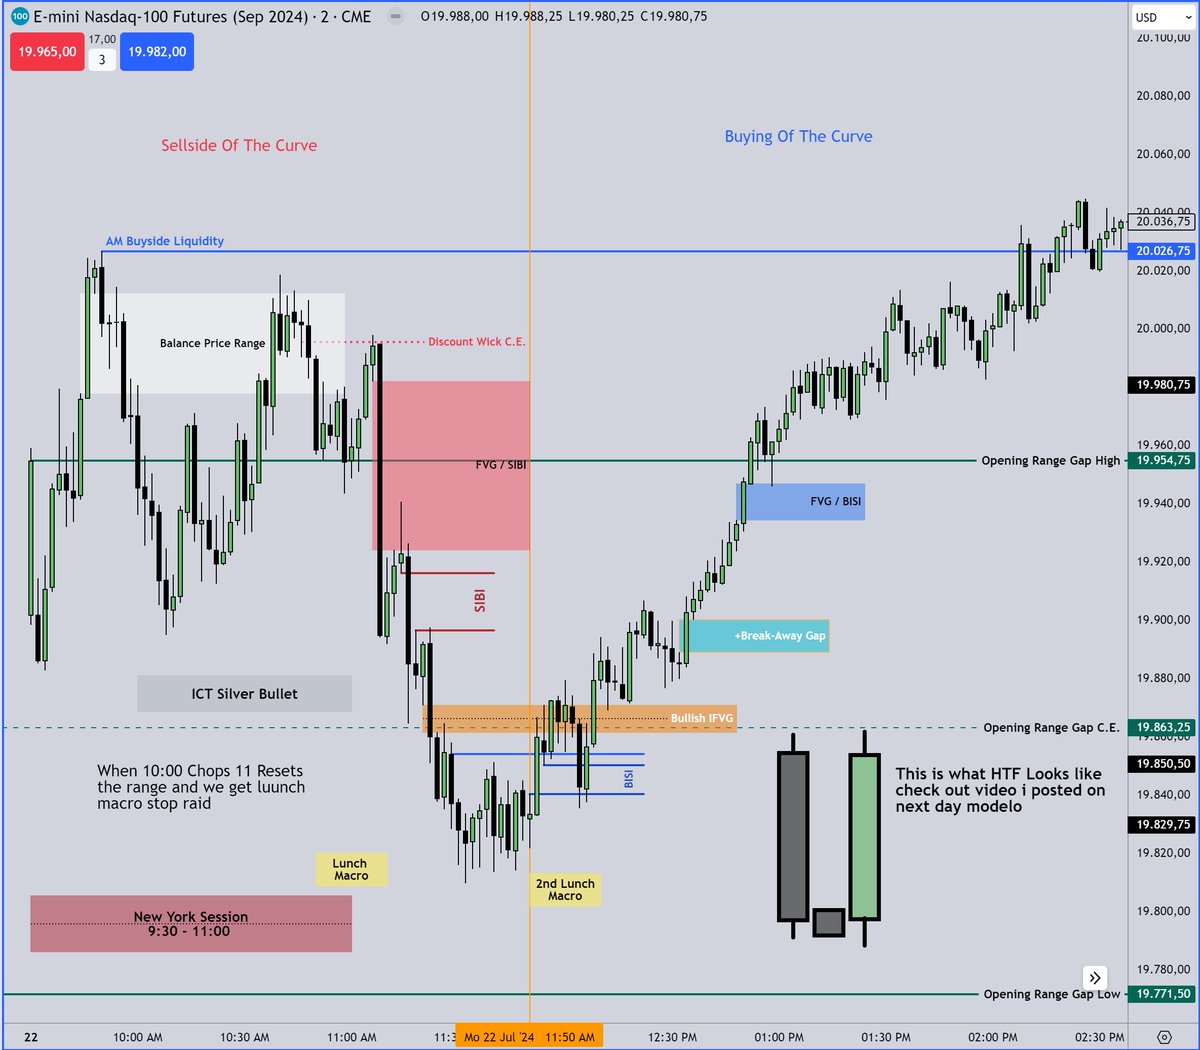
This isn’t a trade recap.
It’s a masterclass.
How to build bias step-by-step using ICT Daily Profiles.
Asia → London → NY.
Why my DOLs were set.
Why the move was never random.
10 minutes that will rewire how you see the market.
Bookmark this.
You don’t need indicators.
You just need to understand how price really moves.
ICT always says
it’s all time and price.
The algorithm looks back over the last 20 trading days ( IPDA Data Ranges )
marks the highest high and lowest low,
then splits that range into four parts 👇
0–25% → Deep Discount
25–50% → Lower-Mid
50–75% → Upper-Mid
75–100% → Deep Premium
That’s the dealing range.
Everything that matters happens inside it.
In those zones live the PD arrays &
Daily OHLC
and that’s where price keeps getting drawn to.
If price holds above the lower quadrant,
and those down-close candles keep supporting it…
that’s clean bullish order flow.
This isn’t prediction.
It’s precision how the algorithm delivers price,
exactly like ICT teaches it.
For the full breakdown, watch
ICT’s @I_Am_The_ICT livestream October 18th 2025
📺 Available on his official YouTube channel: “Inner Circle Trader."
When you study price action, you need a roadmap.
What are you going to look for on each timeframe? Which specific concepts are you going to use?
A quick example, from Weekly to 1m (you can use more or fewer concepts — this is just an example):
· Weekly: Weekly bias. What is the most likely draw for that week?
· Daily: IPDA lookback 20 / 40 / 60. Daily bias. Day of week. Key liquidity.
· 60m: IPDA 3-day lookback. Premium & discount. Key liquidity and key imbalances. Daily draw on liquidity.
· 15m: Intraday OHLC. Key opening prices, liquidity and imbalance. Current dealing range. Time-based gaps. Intermarket relationships.
· 5m / 1m: Execution timeframe. How are you going to engage price? Your entry technique based on the higher timeframe charts. 1st P.FVG.
· Time elements.
How do you define a bias or draw? It’s important you know it — you need a framework.
Also, you must understand the concepts you use. Write them. Explain them.
What is key liquidity? Define it.
You need specific (algorithmic) definitions for the tools you use. You don’t need every single ICT concept to be profitable, but you must understand the core elements.
Finally, once you’ve defined all the concepts/tools, you can study price with a roadmap.
Show up every day. Build your own model. Test it. Prove it. Build your edge.
Be a Winner.
📉 ICT Daily Profile Logic – Asia → London → NY (Bookmark this)
ICT teaches: each session builds the daily candle.
If you understand how Asia sets the trap, you can forecast London’s intent and strike in New York with precision.
Here’s the full playbook:
1. Asia consolidates
→ London raids one side
→ NY delivers to the opposite side
🧠 Classic Power of 3: accumulation → manipulation → distribution.
2. Asia raids a PDH/PDL
→ London continues that move
→ NY reverses to rebalance
🧠 Trap confirmed. NY becomes the delivery leg.
3. Asia sets the high or low of the day
→ London respects it
→ NY expands away from it
🧠 Expect strong continuation setups in NYO.
4. Asia creates a large move (displacement)
→ London consolidates
→ NY continues the trend
🧠 ICT calls this a “continuation day.”
5. Asia & London trend in the same direction
→ NY traps late buyers/sellers
→ Reverses hard
🧠 Watch for reversal setups, especially midweek.
ICT says:
“Time + Price = Delivery.”
Asia sets the stage.
London reveals intent.
New York executes.
Study this. Then watch any daily candle form.
🔖 Bookmark it
🔁 RT if this tightened your model
Mark Douglas coached traders for 18 years.
He discovered that trading success is 80% psychology, 20% technique.
Here are his 10 most important lessons: