@MarketMike HYG divergences on the 60min have historically led SPY by 2-4 sessions on average - thats the part most people miss, they see the signal but dont know when to act on it
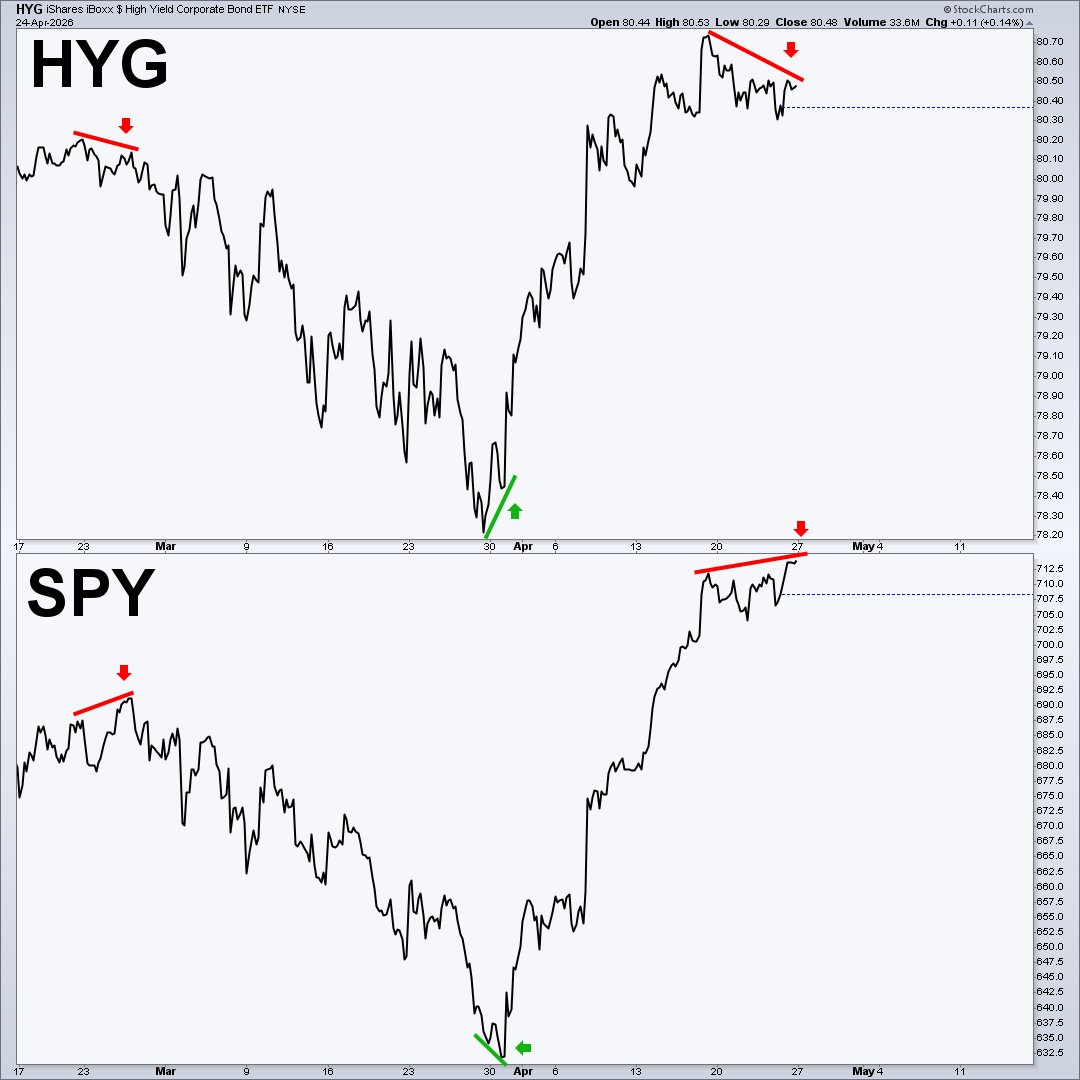
Almost nobody looks at this chart… but it’s one of my favorite ways to spot when a move may be running on fumes.
This is a simple 60‑minute line chart of high yield vs SPY. I use it to track divergences between “smart money” (bonds) and “dumb money” (equities).
The last major signal was at the bottom, high yield quietly started putting in a higher low while stocks were still puking. That helped flag the turn.
Fast‑forward to now: $JNK and $HYG are not confirming this latest push in SPY. Stocks are pressing higher, high yield is stalling out.
That doesn’t guarantee a top, but when "Smart Money" refuses to play along, I take note.