Ciclista furioso,patinador, corazón rebelde,salsero, informático, creo en la palabra empeñada, en la buena voluntad de las personas, y en la lucha de las ideas
srprofumo, compra realizada el 5 de octubre y nada que llega el pedido, ojo con srprofumo, posible empresa fraude- Franco Arellano Galaz, devuelve el dinero
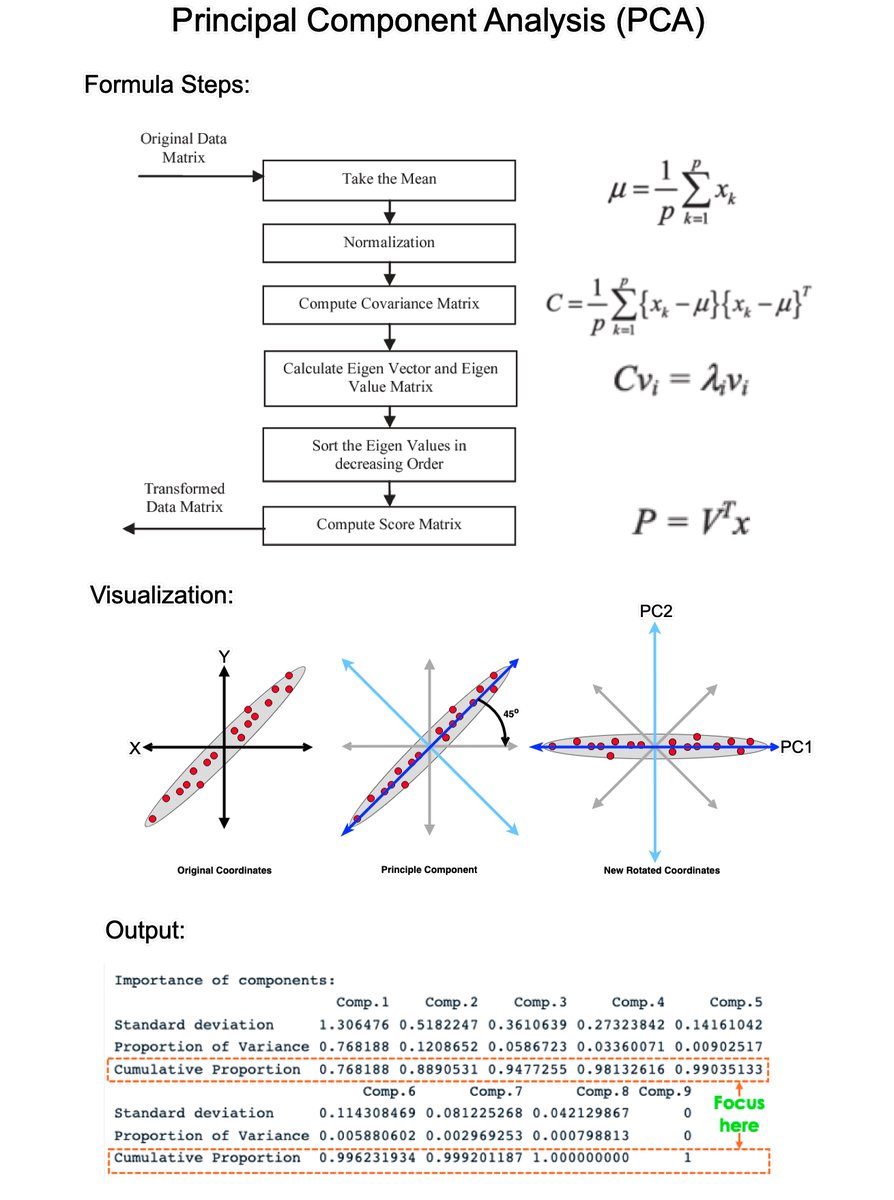
Principal Component Analysis (PCA) is the gold standard in dimensionality reduction with uses in business. In 5 minutes, I'll teach you what took me 5 weeks. Let's go!
1. What is PCA?: PCA is a statistical technique used in data analysis, mainly for dimensionality reduction. It's beneficial when dealing with large datasets with many variables, and it helps simplify the data's complexity while retaining as much variability as possible.
2. How PCA Works: PCA has 5 steps; Standardization, Covariance Matrix Computation, Eigen Vector Calculation, Choosing Principal Components, and Transforming the data.
3. Standardization: The first step in PCA is to standardize the data. Since the scale of the data influences PCA, standardizing the data (giving it mean of 0 and variance of 1) ensures that the analysis is not biased towards variables with greater magnitude.
4. Covariance Matrix Computation: PCA looks at the variance and the covariance of the data. Variance is a measure of the variability of a single feature, and covariance is a measure of how much two features change together. The covariance matrix is a table where each element represents the covariance between two features.
5. Eigenvalue and Eigenvector Calculation: From the covariance matrix, eigenvalues and eigenvectors are calculated. Eigenvectors are the directions of the axes where there is the most variance (i.e., the principal components), and eigenvalues are coefficients attached to eigenvectors that give the amount of variance carried in each Principal Component.
6. Choosing Principal Components: The eigenvectors are sorted by their eigenvalues in descending order. This gives the components in order of significance. Here, you decide how many principal components to keep. This is often based on the cumulative explained variance ratio, which is the amount of variance explained by each of the selected components.
7. Transforming Data: Finally, the original data is projected onto the principal components (eigenvectors) to transform the data into a new space. This results in a new dataset where the variables are uncorrelated and where the first few variables retain most of the variability of the original data.
8. Evaluation: Each PCA component accounts for a certain amount of the total variance in a dataset. The cumulative proportion of variance explained is just the cumulative sum of each PCA's variance explained. Often this is plotted on a Scree plot with Top N PCA components.
====
Ready to learn Data Science for Business?
I put together a free on-demand workshop that covers the 10 skills that helped me make the transition to Data Scientist: https://t.co/6Ji4GtOTzy
And if you'd like to speed it up, I have a live workshop next week where I'll share how to use ChatGPT for Data Science: https://t.co/Ydsmzv7trP
If you like this post, please reshare ♻️ it so others can get value.
This book changed how I look at machine learning.
I just finished it. Worth every second.
This is for anyone who wants to build real-world machine learning applications. It's practical and to the point.
Interpretability 101.
Link: https://t.co/UYTRvN9key
Deja de limitarte a ChatGPT
Las extensiones de Chrome basadas en IA están causando estragos en la industria de la IA!
Aquí hay 8 extensiones de Chrome para ahorrar horas de trabajo
🧶HILO🧶
🎨 Brainly es un sistema de diseño mega completo con herramientas para Motion UX y animación.
🧮 Con una calculadora que genera el código en CSS para tus microinteracciones.
https://t.co/5UW7qvObb0