We have now released 𝐃𝐈𝐀-𝐍𝐍 𝟐.𝟎!
DIA-NN 2.0 Academia: https://t.co/hxgTs5kYau.
We also now offer DIA-NN Enterprise for Industry, please contact Aptila Biotech https://t.co/QFYuxu7QCl.
Identification numbers and FDR control of Spectronaut 18 vs DIA-NN 1.9 as benchmarked by Jesper Olsen and colleagues (Nature Methods)
https://t.co/YjH2KVtrGh
DIA-NN 2.0 release is almost ready, will come with some big news. One is scanning methods support, at the moment doing some tuning of the algorithm using Synchro-PASEF data by @labs_mann :) Turns out, 'Q1 information' is really helpful for gaining peptidoform confidence. Likely also channel-confidence in plexDIA.
Deeply honored to receive the MCP Lectureship award at @SSP2024. Thank you for this incredible opportunity to share our work at @broadinstitute. Very grateful for all the support from my amazing @LeibnizFMP lab and collaborators!
#interactomics#3Dproteome
Incredibly honoured to receive the EuPA award. Tremendous thanks to @lilley_ks and all amazing colleagues at the @CamCProteomics, the birthplace of DIA-NN, as well as my fantastic lab members, our collaborators and the proteomics community for all the support!
Are you using mass spec based proteomics to study endogenous proteolytic activity? This work describes an R package TermineR for downstream processing (annotation, visualization, differential analysis etc.) of semi-specific search results from #FragPipe. https://t.co/2yZ6MzAFp4
I made a few more tutorial videos on the newest versions of DIA-NN & Fragpipe for those new to the software. Because why pay us when you can do it yourself right? https://t.co/6zX8WiBAHG
DIA-NN now supports visualisation. View the DIA-NN analysis directly in Skyline (many thanks to @SkylineUW and @nesvilab teams for implementing and testing the required interface!) as well as in the integrated DIA-NN Viewer.
DDA used to be considered 'more reliable', as one could be confident in correct peptidoform assignment. Now also works for any DIA data, even from 10 years ago :)
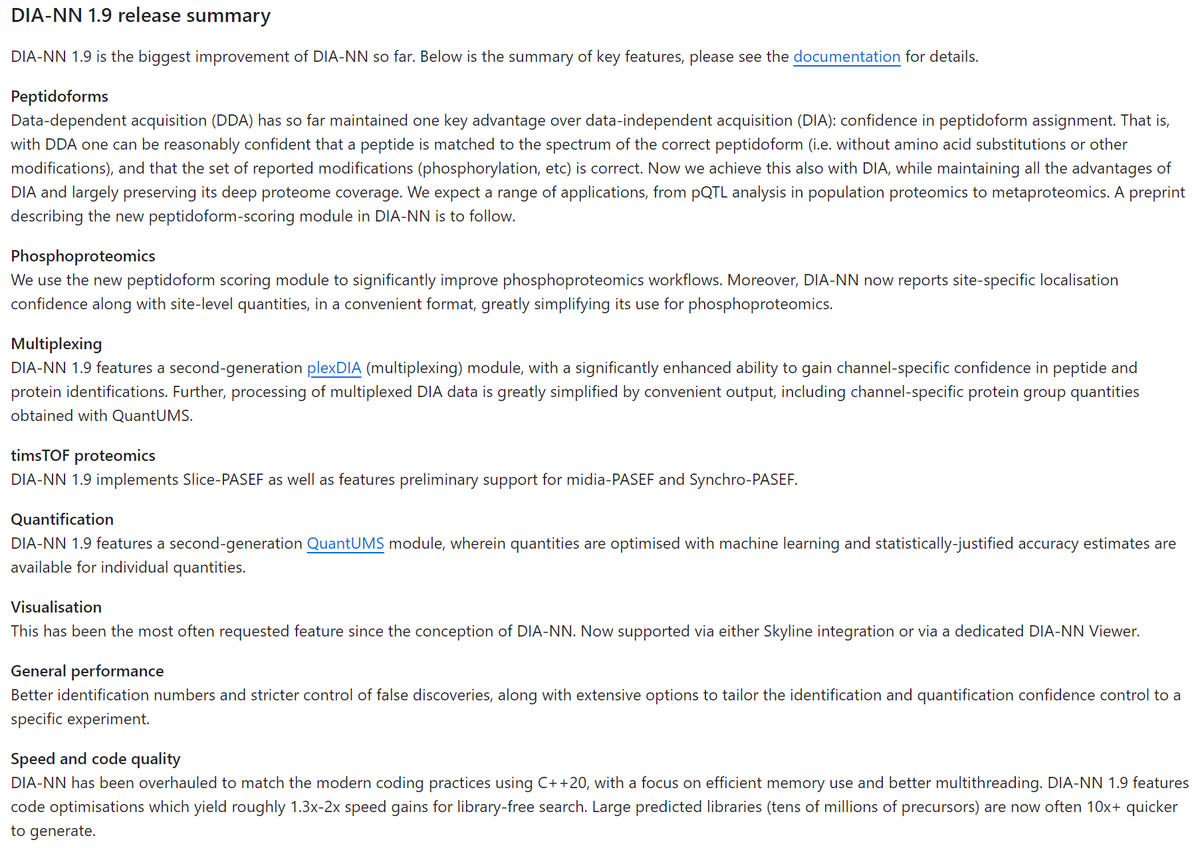
Excited to announce DIA-NN version 1.9, our software suite for proteomics data processing!
A range of cool new features and general performance improvements. We consider it the most significant update in the history of DIA-NN.
https://t.co/RKzniysMLg
Finally published! Delighted to introduce CLASP: a novel framework for spatial proteomics. Using XLMS we unveiled intricate protein localizations & topologies in mitochondria. CLASP offers higher resolution and throughput than BioID/APEX.
https://t.co/sYLv4CEust
Read this technote by @SCIEXOmics where they demonstrate their Mag-Net workflow using @ReSyn_Bio bead enrichment and #ZenoSWATH#DIA. These methods pave the way for enabling robust #plasma analysis that can be automated for large cohort analyses. https://t.co/IrBJQaMQih
I am thrilled that our team @KasperFugger and @pedrobeltrao received a @HFSP Research Grant. We will have loads of fun exploring the chemical space of bioactive modified nucleotides and their modifying/detoxifying enzymes! We will soon look for a Postdoc (Chemical Biology)!
Now, I kind of understand what algorithms likely lead to this kind of output. Although DIA-NN (dev version at least) will likely instead report just a single localisation instead of three. The question is, how people interpret this for biology inference? Is only T814 considered confident. If yes, why the first precursor claims ceirtainty in S818? Are these scores believable?
Took a look at a Spectronaut phosphoproteomics report (PXD034128). How to interpret this? Three precursors with different phosphate localisations matched to the same RT, first one has T828 annotated but 98.4% confidence in phosphate being on S818. The second actually has S818 annotated, but confidence only 66.1% now. The third one now says it's T814 with 99.4% confidence. So when you look at this report, how many 'class I' phosphosites you count?
I can confirm that both DIA-NN 1.8.1 and latest beta versions have correctly controlled FDR on Orbitrap Astral data - checked by searching plasma EV data https://t.co/WZ3oipx5aG against human + E.coli database, real FDR is in the range 1%-2% when 1% filter is applied
DIA-NN at present is the best tool for „free“ to get most out of DIA data - but doesn‘t come with data viz features.
This is a great tutorial to import DIA-NN results into skyline to vizualize results
https://t.co/L4qIwnK1UC