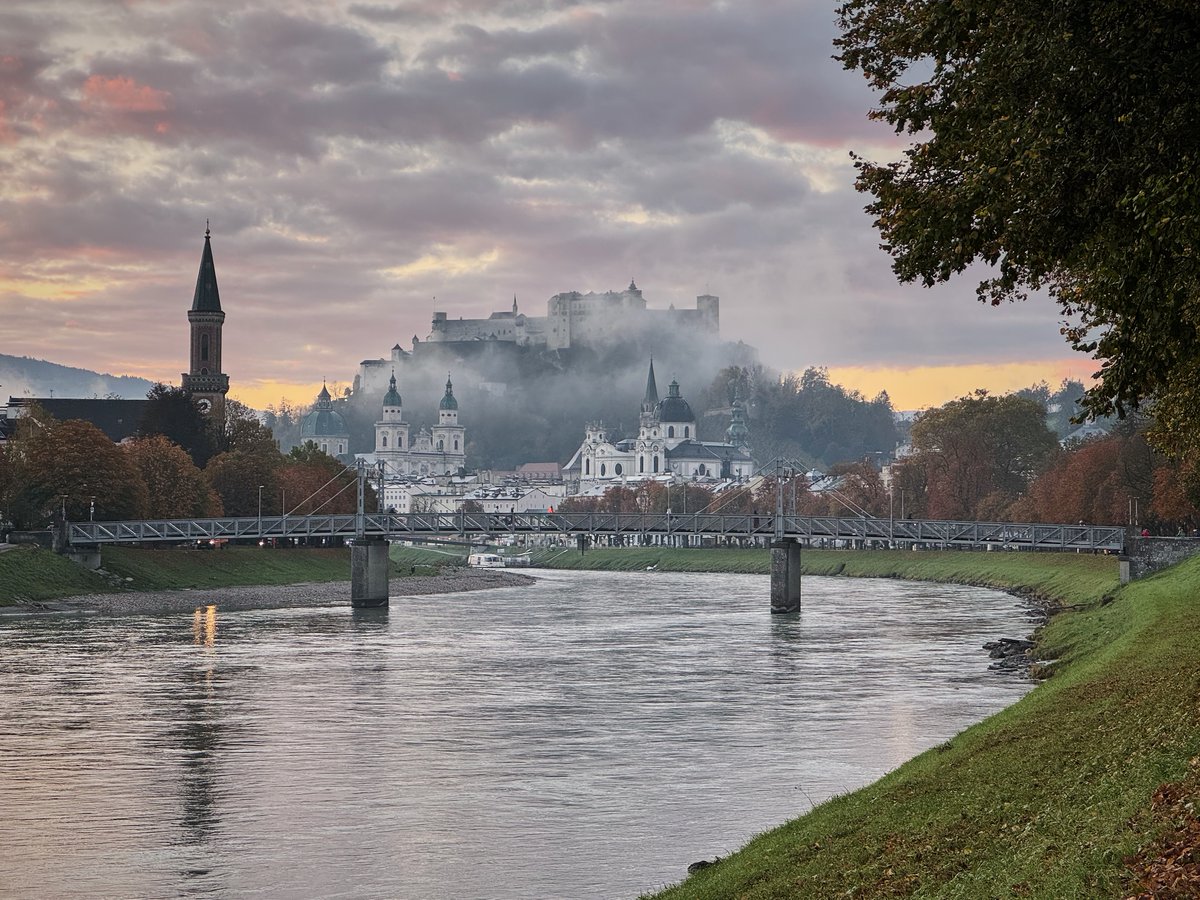
The older I get, the more I think about how just having our parents by our side can often turn a public space into a warm and safe bubble. Dozing off on a train for instance.
#littlekid#trainride#childhood#mom
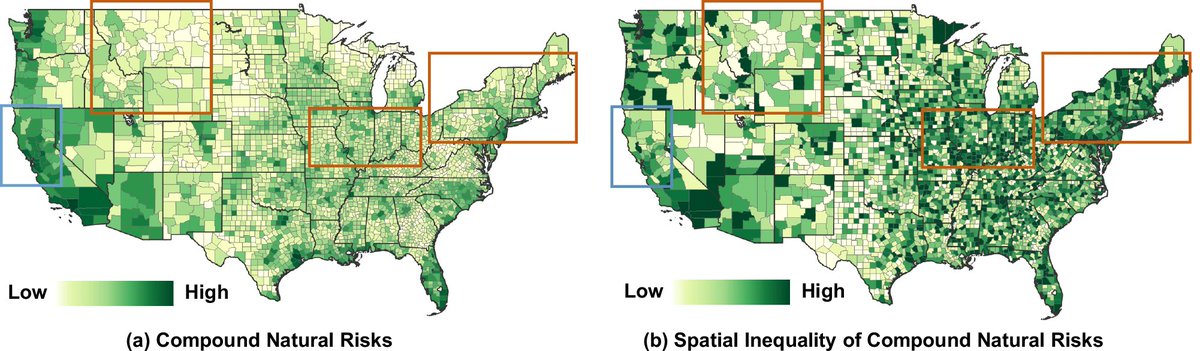
Compound natural risks and spatial inequality across US counties, highlighting regions with contrasting risk and inequality levels.
From: npj Urban Sustainability https://t.co/qWD0kJL3ki
I made a tool called Diffusion Explorer that lets you to train and visualize simple 2D diffusion and flow models live in the browser.
You can draw your own distributions and observe how the generated samples converge during training.
Try it live 👇
Our paper with Victor-Alexandru Darvariu and Steve Hailes "Tree search in DAG space with model-based reinforcement learning for causal discovery" is now out in Proceedings of the Royal Society A.
https://t.co/ZxSNFuJkkw
All course materials (slides, readings, code, data)
for Introduction to Urban Science (MIT Press, also in Chinese) are now freely available on Github: https://t.co/tUzaDveRR5
Make them your own and keep in touch!
Happy 2025!
New paper: Understanding of the predictability and uncertainty in population distributions empowered by visual analytics
by Luo et al.
#ijgis
https://t.co/27dvGjchUW
Creating publication-ready plots in R is easier than ever with ggpubr. This extension for ggplot2 simplifies the process of generating clean and professional graphics, especially for exploratory data analysis and reporting.
The attached visual, which I created using ggpubr, demonstrates its versatility. It includes a density plot with group comparisons (upper right), a boxplot with statistical significance annotations (lower left), and a grouped bar chart (lower right). These examples showcase how ggpubr helps streamline the creation of informative and visually appealing plots, perfect for presentations and publications.
If you’d like to learn how to create publication-ready visualizations with ggpubr and other tools, join my online course, Data Visualization in R Using ggplot2 & Friends. In this course, you’ll learn how to design polished graphics like these step-by-step! Learn more by visiting this link: https://t.co/ztlEzoEDWv
#Rpackage #ggplot2 #programmer #tidyverse #datastructure #Data #DataViz #VisualAnalytics
An explainable spatial interpolation method considering spatial stratified heterogeneity: International Journal of Geographical Information Science: https://t.co/1zcTuGq7xM
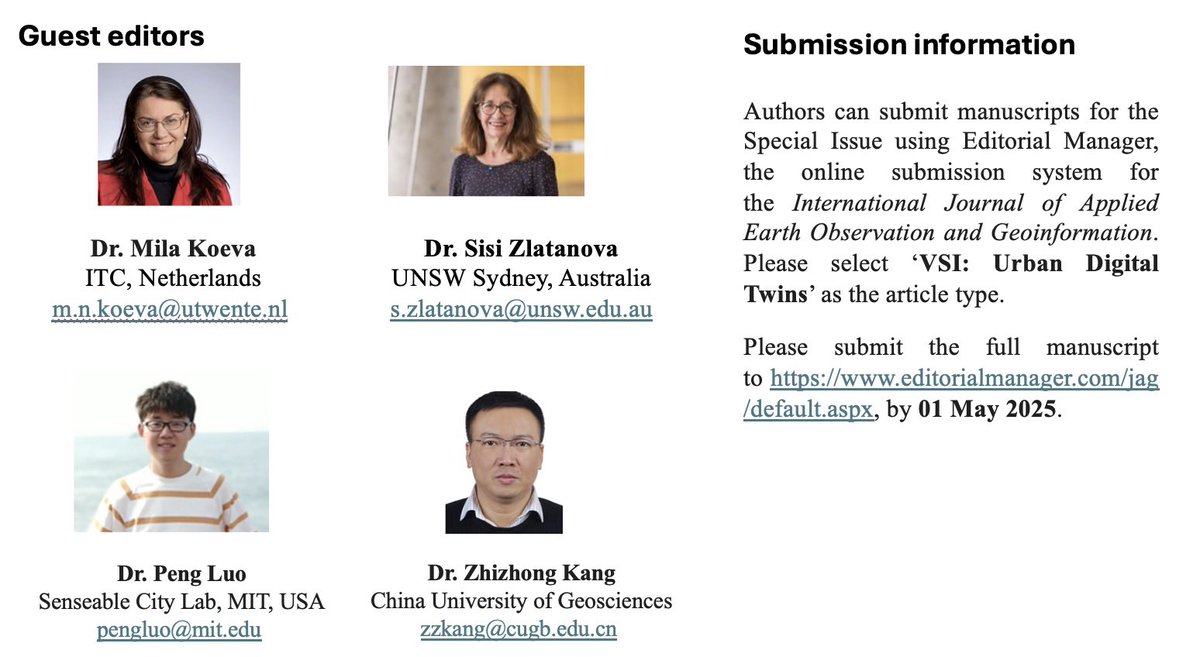
We (Mila Koeva, Sisi Zlatanova ,Zhizhong Kang ) are organizing a special issue on Digital Twins in the International Journal of Applied Earth Observation and Geoinformation (JAG).
https://t.co/oQDE4Rfv7A
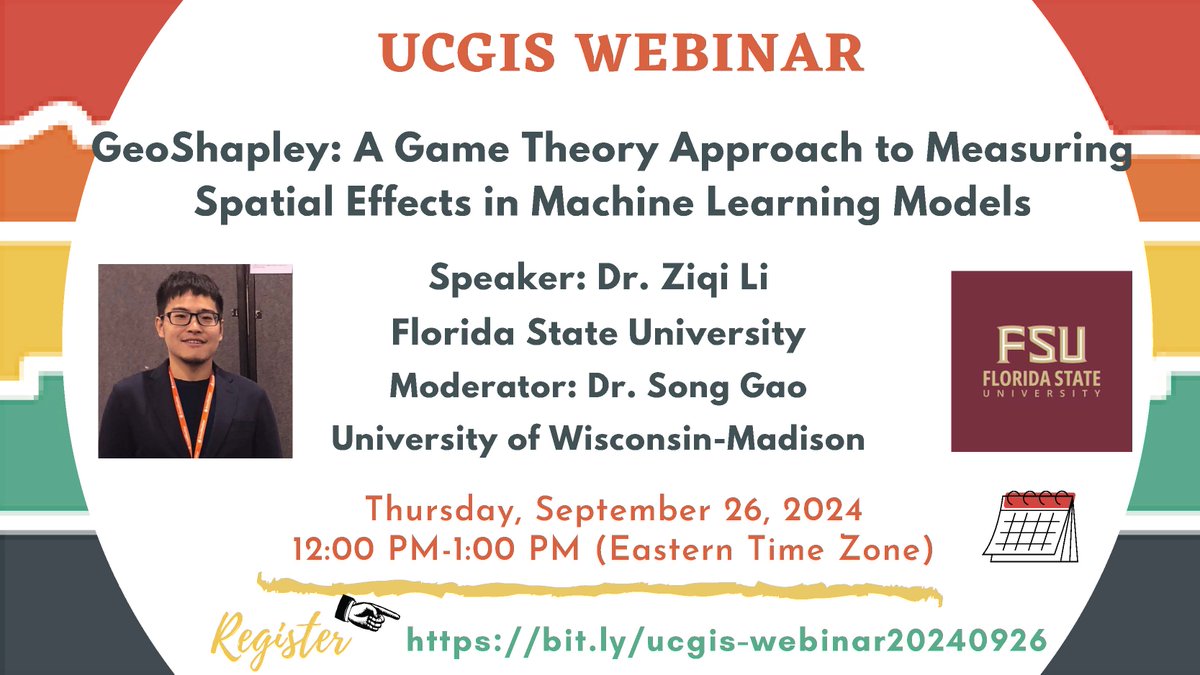
UCGIS Webinar 2024 Fall series kicks off 9/26 with Dr. Ziqi Li (Florida State University) about GeoShapley: A Game Theory Approach to Measuring Spatial Effects in Machine Learning Models. Register: https://t.co/dLCjjlAz1X
Thrilled to share a recent work published on @ijgis from GeoDI Lab @UMNGeography.
We discovered mesoscopic structures of spatial network evolution that could reveal the collective behaviors of flow-evolutionary characteristics.
https://t.co/MhCjw3N8AG
🚀 Excited to share our works accepted at #IJCAI24 AI for Social Good Track! 1️⃣ A new Singapore parking availability dataset and prediction model: https://t.co/9DNhH4xW2r
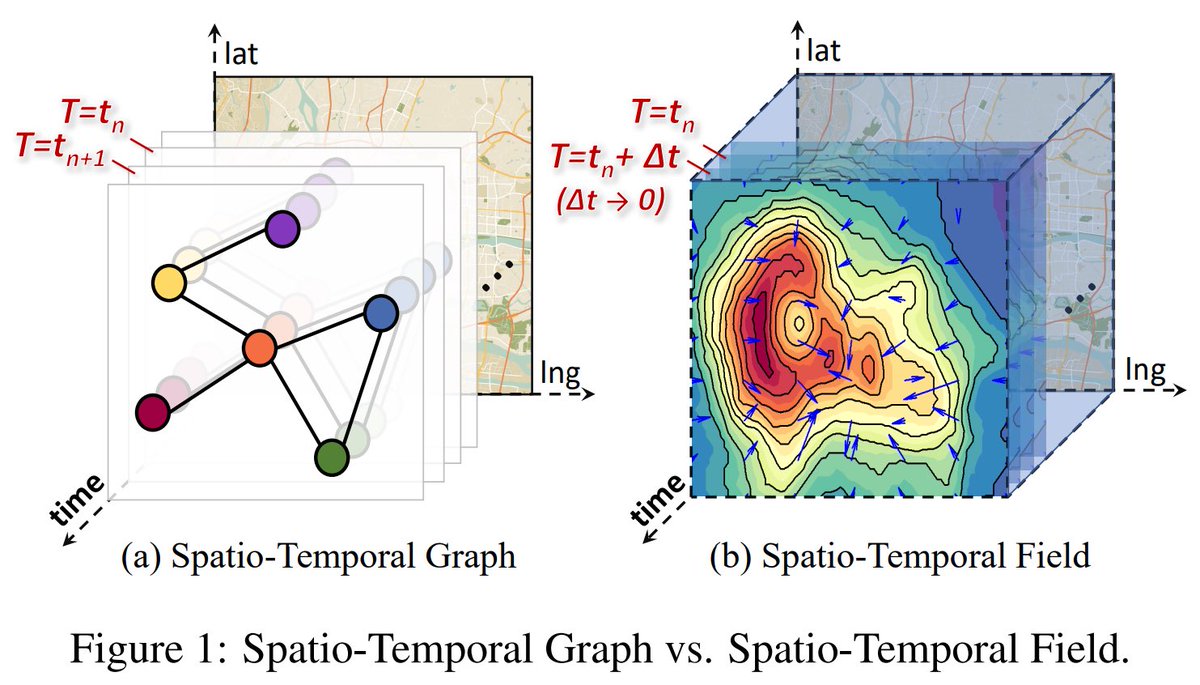
2⃣ A novel Spatio-Temporal Field Neural Network (STFNN) for inferring air quality: https://t.co/y5t6SUV2ER
Call for papers for a special issue on "Revisiting Spatiotemporal Modeling in the Era of GeoAI" in Computational Urban Science @CUSC_Springer organized by @DiZhu_Patrick@DuncanPLee@luopku and myself. More details: https://t.co/4erAdicyQY