Get access to our research, analysis, and signals, all in one platform—free for 7 days.
Our coverage extends across more than 140 assets, in crypto, stocks, indices, and commodities. Whatever you trade, we're already in.
Unlike other firms, we combine both technical analysis and quantitative algorithms to bring an unparalleled level of confidence in positions we take.
All of our analysts are actively managing or working at a hedge fund. We don't publish theory, but what institutional desks are actually doing.
Create your free account by clicking the link in our bio, or heading to: https://t.co/2hP0q45N5A.
Stop trading against the institutions.
Start trading alongside them.
While retail reacts to CNBC, billion-dollar funds have already rotated.
Get their playbook free – analysis, education, and tools at https://t.co/TXeQLjRyCR.
Shipowners just placed their BIGGEST bet in history: A record 262 supertankers are now on order at shipyards worldwide, up over +1,000% in just 2 years.
Each new vessel can carry up to 2 MILLION barrels of crude oil.
To put this into perspective, that's roughly the amount of oil Germany, Europe's largest economy, consumes in an entire day.
Combined, the full orderbook adds ~524 million barrels of carrying capacity.
In other words, these ships could move ~5 DAYS of global oil consumption in a single voyage.
The last time orders hit a record?
October 2008, when ~255 ships flooded the market, crashing daily rates and collapsing tanker revenues.
Yet, owners keep ordering, rushing to capitalize on historic supply chain disruptions.
Buckle up.
Somewhere right now, a portfolio manager is rebalancing a $10B book.
He's not watching the news – he's making it.
Find out where institutional capital is flowing, and the thesis behind every move, with free hedge fund-caliber tools at https://t.co/TXeQLjRyCR.
This is wild: The gap between the best and worst US tech stocks just hit the 2nd-HIGHEST level in history.
Over the last 3 months, the top 20% of tech stocks have outperformed the bottom 20% by ~120 percentage points.
In other words, the winners are +110% while the losers are -10% – over the SAME 3 months.
To put this into perspective: this spread peaked at ~135 points during the 2000 Dot-Com Bubble.
We are now nearly there.
And the gap has QUADRUPLED in a year, outpacing 1999-2000.
The tech rally has almost never been this concentrated.
The position that makes your stomach turn is often the one institutions sized into last quarter.
Get paid to be early.
Free thesis breakdowns at https://t.co/TXeQLjRyCR.
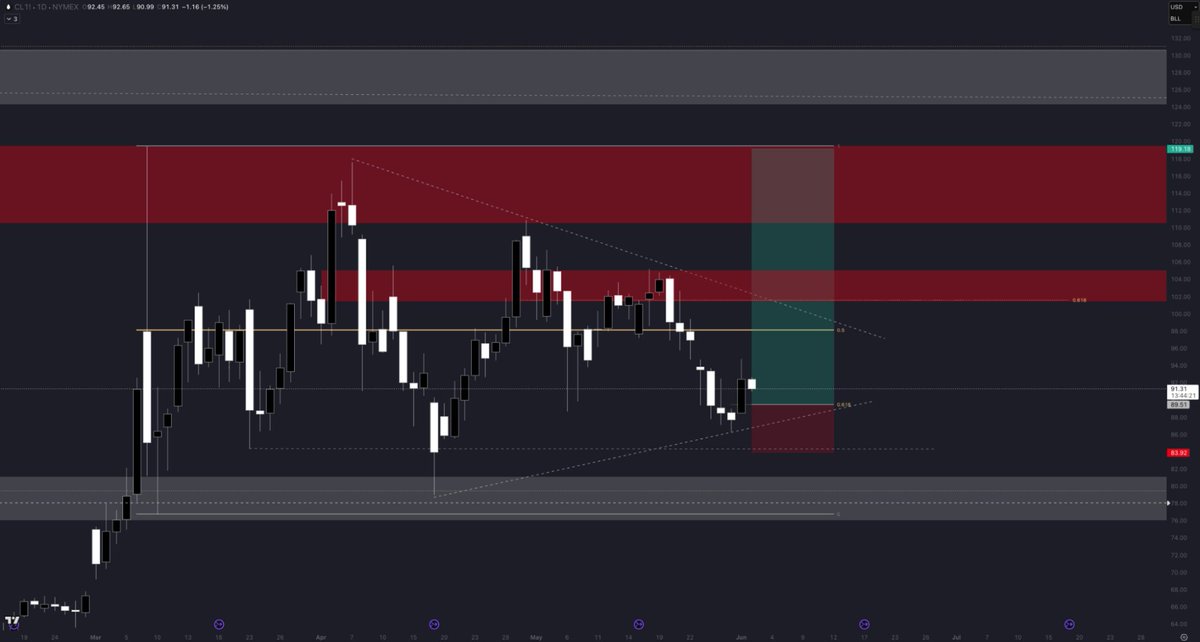
This is key: Crude oil has defended the $85 region on EVERY single retest since early March, all while maintaining the higher-timeframe bullish structure it established that month.
In other words, the same buyers keep showing up at the same level.
Even as negotiations collapse and reserves drain.
That is not weakness.
That is demand absorbing supply at a floor.
We remain bullish.
Ever wonder why the market moves before the news breaks?
It's because the news isn't the catalyst – positioning is.
See where the world's largest allocators are placing capital right now, free, at https://t.co/TXeQLjRyCR.
Relative Unrealized Profit & Loss: Reading the Crowd's Real Position
You do not need to call the exact dot. Respect what the metric shows instead.
When the screen bleeds DEEP NAVY and the crowd heads for the exits, that is not the time to join them.
Strong hands loaded during prior prints.
Weak hands supplied the liquidity on the other side.
In other words, the data has already isolated the capitulation windows and history shows the darkest prints were the moments the strongest hands stepped in rather than stepped away.
The metric simply identifies those conditions.
It does not demand perfect timing on the exact low.
Sectors don't rotate on earnings.
They rotate when the biggest allocators finish accumulating.
See the rotation before it becomes a Bloomberg headline.
Free at https://t.co/TXeQLjRyCR.
The 2000 IPO Collapse – and Why Burry's Watching
Michael Burry, who predicted the 2008 crisis, recently noted that the upcoming IPOs of SpaceX, OpenAI, and Anthropic could raise as much capital as more than 300 internet and tech IPOs did in 2000 combined.
That year is the cautionary tale.
The U.S. IPO market produced 446 deals raising $108.15 BILLION, led partly by foreign issuers and AT&T Wireless's $10.62 BILLION offering – the largest U.S. issuer IPO in history.
A euphoric Q1 saw the Nasdaq hit an all-time high of 5,132 on March 10, with the average IPO nearly doubling on its first trading day.
Tech accounted for roughly 70% of all deals in the first three quarters.
Then it broke.
That tech share fell to 48% in Q4 as the sector that drove the mania was abandoned.
Once-high-flying start-ups that raised at peak valuations faced layoffs, distressed sales, and bankruptcy.
By Q4, only 58 IPOs priced and gross proceeds collapsed 63% to $17.45 BILLION – just nine in all of December. The Nasdaq closed the year at 2,470.
The market wide open in March was effectively closed by December.
The "irrational exuberance" had fully reversed.
The loudest trades are the ones filed quietly on Friday afternoons.
Read between the lines of every major filing with free hedge fund-quality research at https://t.co/TXeQLjRyCR.
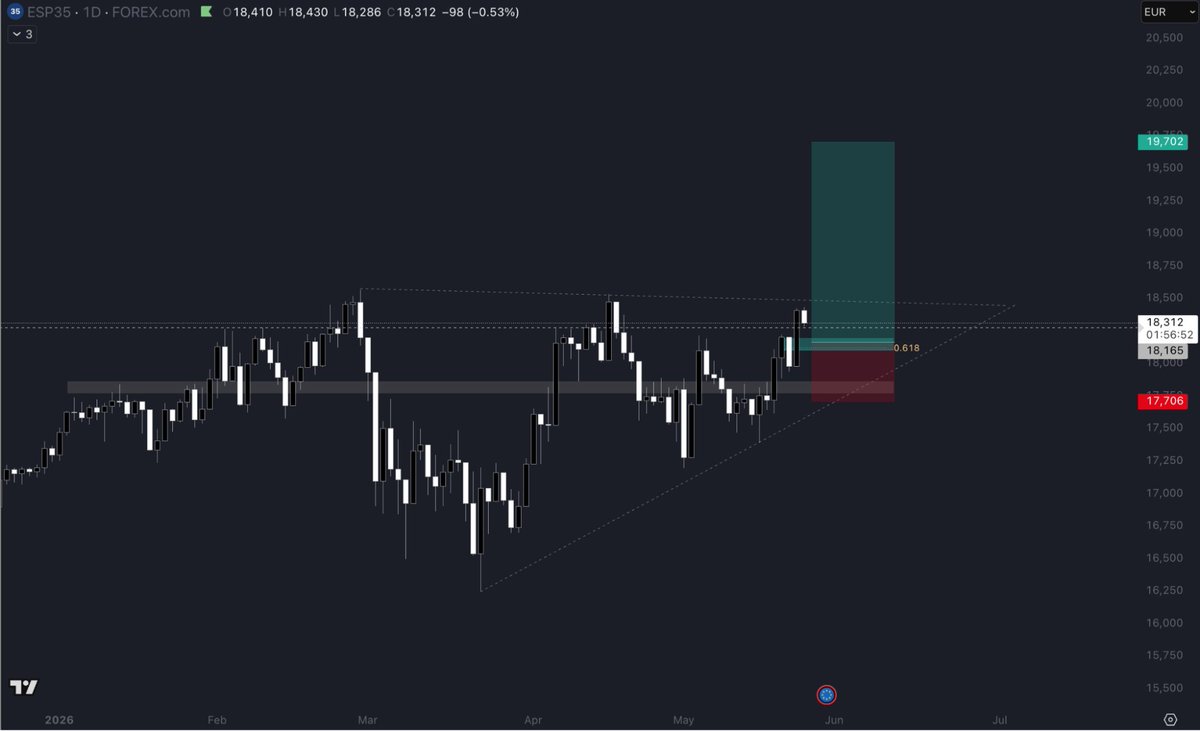
The Spain 35 Situation: Emerging markets are demonstrating robust accumulation on their macro higher-timeframe structure while major indices consolidate after their post-ceasefire rallies.
Spain 35 is compressing into an inverse head and shoulders that can break aggressively.
Tariffs are raising import and export costs for the largest economies.
This is creating a tailwind for domestic trade and niche agricultural exporters.
Somewhere right now, a portfolio manager is rebalancing a $10B book.
He's not watching the news.
He's making it.
Find out where institutional capital is flowing, and the thesis behind every move, with free hedge fund-caliber tools at https://t.co/TXeQLjRyCR.
This is BEYOND insane: $2.8 BILLION flooded into 16 newly-launched leveraged Korean semiconductor ETFs on their FIRST DAY of trading.
The Samsung KODEX SK Hynix ETF leads with $1.06 BILLION in assets. The Samsung KODEX Samsung Electronics ETF follows at $765 million. The Mirae Asset Tiger SK Hynix ETF holds another $495 million.
These products were BANNED in Korea until this week. They require DAILY rebalancing to maintain their leverage ratio.
In other words, they are mechanically forced to buy into rallies and sell into declines – a volatility ACCELERATOR.
Meanwhile, Samsung and SK Hynix already account for ~50% of the ENTIRE KOSPI index. Any sector-specific shock will now be EXTREMELY AMPLIFIED by the forced selling of these multi-billion dollar funds.
The risk materialized IMMEDIATELY.
Today, the KOSPI fell -4.7%. Samsung dropped -6.4%. SK Hynix fell -4.1%. And one Samsung leveraged ETF plunged nearly -10% in a single session.
Such market developments NEVER happen at the market bottom.
Retail is still reading the flop.
Institutions already called the river.
See the hand the big players are actually holding with free hedge fund-caliber research, education, and tools at https://t.co/TXeQLjRyCR.
The Tech vs. Medical Situation: The Information Technology sector is up a MASSIVE +225.7% since this bull market began in October 2022.
Health Care?
Just +18.8% over the same period.
DEAD LAST of all 11 sectors.
In other words, tech has outperformed health care by more than 200 PERCENTAGE POINTS in a single bull run.
Tech sits at ALL-TIME highs.
Medical sits at relative ALL-TIME lows.
Historically, strategic rebalancing of your portfolio from top gainers to the worst gainers yields positive results and reduces the risk of over-concentration over a longer time horizon.
@AUaussieF It all depends on the macro environment, currently commodities are performing best due to the landscape, but crypto and equities tend to have higher risk:reward opportunities.
Get access to our research, analysis, and signals, all in one platform—free for 7 days.
Our coverage extends across more than 140 assets, in crypto, stocks, indices, and commodities. Whatever you trade, we're already in.
Unlike other firms, we combine both technical analysis and quantitative algorithms to bring an unparalleled level of confidence in positions we take.
All of our analysts are actively managing or working at a hedge fund. We don't publish theory, but what institutional desks are actually doing.
Create your free account by clicking the link in our bio, or heading to: https://t.co/2hP0q45N5A.