Sem zueira, estou eu no hospital Unimed e daí entra uma técnica de enfermagem na sala de espera chamando: "O responsável do Gohan?"
Eu pensei: caraio, alguém pos o nome do filho de Gohan!
queria morrer quando tinha q pedir dinheiro pro meu pai pra coisas basicas tipo pegar onibus pra ir pra escola, ou comprar material, ou comprar roupa de frio pq era inverno e eu só tinha 1 casaco, e ele olhava pra mim e perguntava sério:
mas o que você fez pra merecer isso?
nossa, meu sangue fervia! a vontade era falar ENTÃO ENFIA NO SEU CU SEU FODIDO DESGRAÇADO 🙃
🎉 Announcing the Home Assistant roadmap! Unlike other public roadmaps, ours is an open call for contributions in product areas we are focusing on.
In this update, we're focusing on a home-approved smart home, piece of mind, and more! Read on here: 👇🏼 https://t.co/hnlsTnyDgA
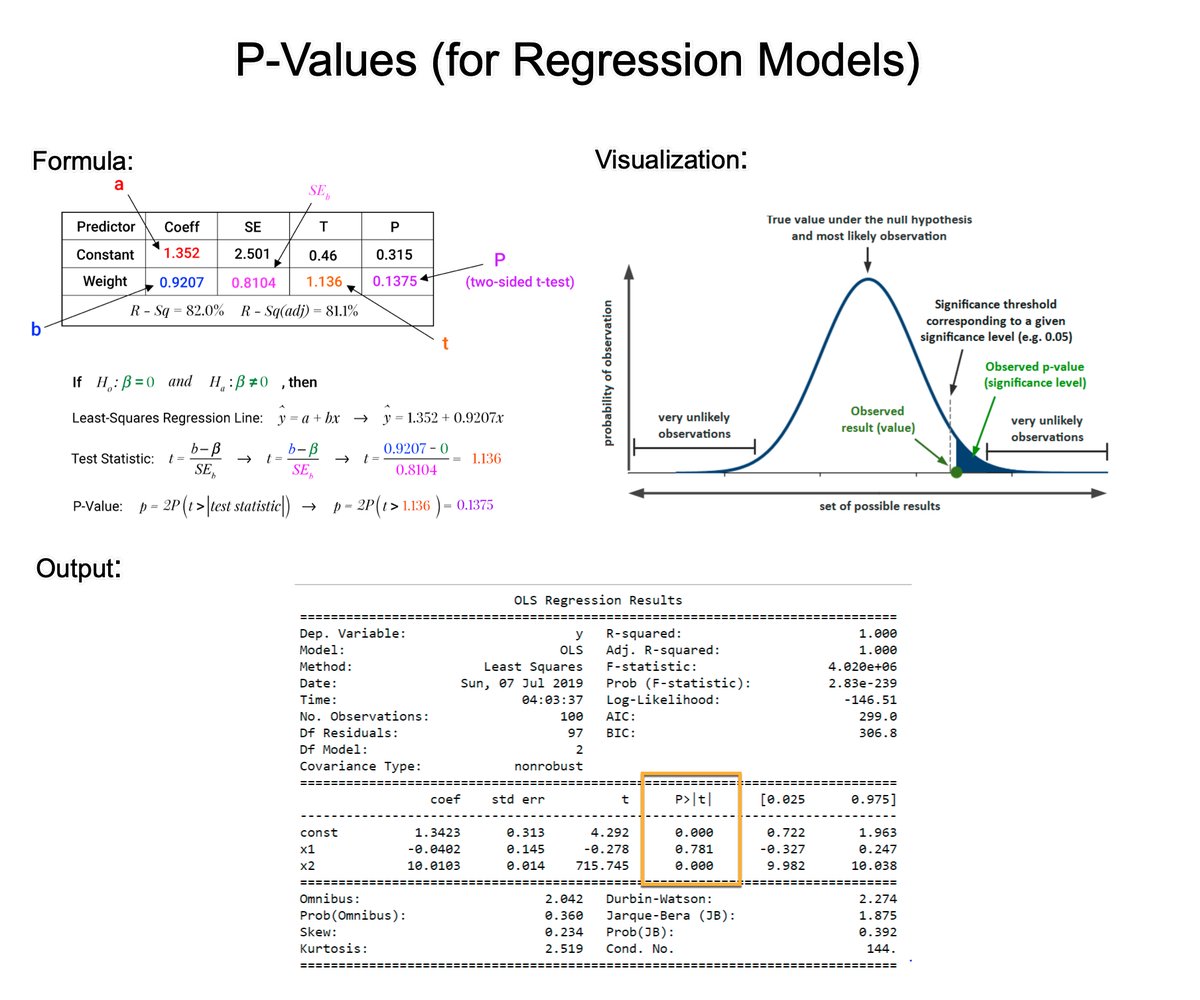
Understanding P-Values is essential for improving regression models. In 2 minutes, learn what took me 2 years to figure out.
1. The p-value: A p-value, in statistics, is a measure used to assess the strength of the evidence against a null hypothesis.
2. Null Hypothesis (H0): This is a general statement or default position that there is no relationship between two measured phenomena or no association among groups. For example, the regressor does not affect the outcome.
3. Alternative Hypothesis (H1): This is what you want to test for. It is often the opposite of the null hypothesis. For example, that the regressor does affect the outcome.
4. Calculating the p-value: The p-value for each coefficient is typically calculated using the t-test. There are several steps involved. Let's break them down.
5. Coefficient Estimate: In a regression model, you have estimates of coefficients (β) for each predictor. These coefficients represent the change in the dependent variable for a one-unit change in the predictor, holding all other predictors constant.
6. Standard Error of the Coefficient: The standard error (SE) measures the accuracy with which a sample represents a population. In regression, the SE of a coefficient estimate indicates how much variability there is in the estimate of the coefficient.
7. Test Statistic (T): The test statistic for each coefficient in a regression model is calculated by dividing the Coefficient Estimate / Standard Error of the Coefficient. This gives you a t-value.
8. Degrees of Freedom: The degrees of freedom (df) for this test are usually calculated as the number of observations minus the number of parameters being estimated (including the intercept).
9. P-Value Calculation: The p-value is then determined by comparing the calculated t-value to the t-distribution with the appropriate degrees of freedom. The area under the t-distribution curve, beyond the calculated t-value, gives the p-value.
10. Interpretation: A small p-value (usually ≤ 0.05) indicates that it is unlikely to observe such a data pattern if the null hypothesis were true, suggesting that the predictor is a significant contributor to the model.
There you have it- my top 10 concepts on p-values. The next problem you'll face is how to apply data science to business.
I'd like to help.
I’ve spent 100 hours consolidating my learnings into a free 5-day course, How to Solve Business Problems with Data Science. It comes with:
300+ lines of R and Python code
5 bonus trainings
2 systematic frameworks
1 complete roadmap to avoid mistakes and start solving business problems with data science, TODAY.
👉 Here it is for free: https://t.co/YXG4pL97ZN






![mangaa's tweet photo. Some of the most crazy manga panels i’ve found
[A Thread 🧵] https://t.co/ZdbzZ2R2u8](https://pbs.twimg.com/media/GR1MfmxacAIwOJT.png)