@abocrypto2 With 30x leverage, a price move of approximately 3.33% against your position would wipe out your initial margin, assuming no fees or other costs.
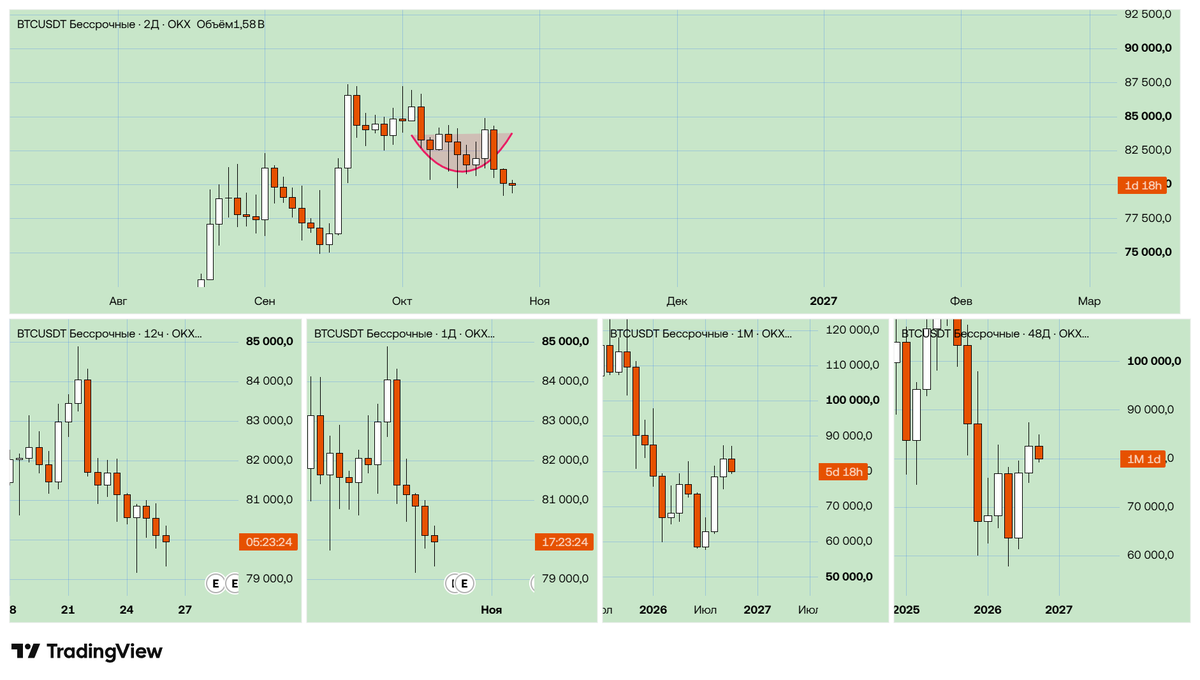
Bitcoin: The Saucer Pattern Has Failed?
On the 2D chart, Bitcoin formed a promising saucer pattern this month, suggesting a potential continuation of the uptrend.
However, the October 22 candle changed the picture dramatically, crushing the hopes of many bulls and long-term holders.
Now, the former bottom of the saucer could become resistance. If this scenario plays out, I’m watching $75,000 as a potential downside target.
Personally, I’d welcome that pullback.
I closed my long at $72,000 after buying around $62,000, securing a profit. Bitcoin then rallied another $15,500 without me. 😂
Was I too early? Probably.
But now I’m watching for a potential re-entry at a lower price.
Sometimes, missing part of a rally is the price you pay for risk management.
Let’s see if Bitcoin gives us another opportunity.
@arbitrerio That's a great question. Honestly, I probably wouldn't have taken the trade if I hadn't seen my partner's result. A good reminder that trading someone else's success can make you abandon your own rules. Lesson learned.
**Trading Journal 📉 | A Costly Mistake**
I decided to trade the breakout of the $IRYS trading range.
The problem? I still had that 400% pump from just two days ago fresh in my mind. And one of my trading partners had made a 50% profit on a trade in this coin.
I haven't traded like this in what feels like 100 years. 😂
But I really wanted to catch a piece of that move and show my partner:
*"Look, bro, I caught a piece of it too!"*
My target was a 25% gain.
Instead, I took a 4% loss.
**10 years of day trading, and emotions can still get the better of you.**
Lesson learned: Don't chase a move just because someone else caught it. Stick to your strategy and let the setup come to you.
#TradingJournal #CryptoTrading #IRYS #PriceAction #TradingPsychology
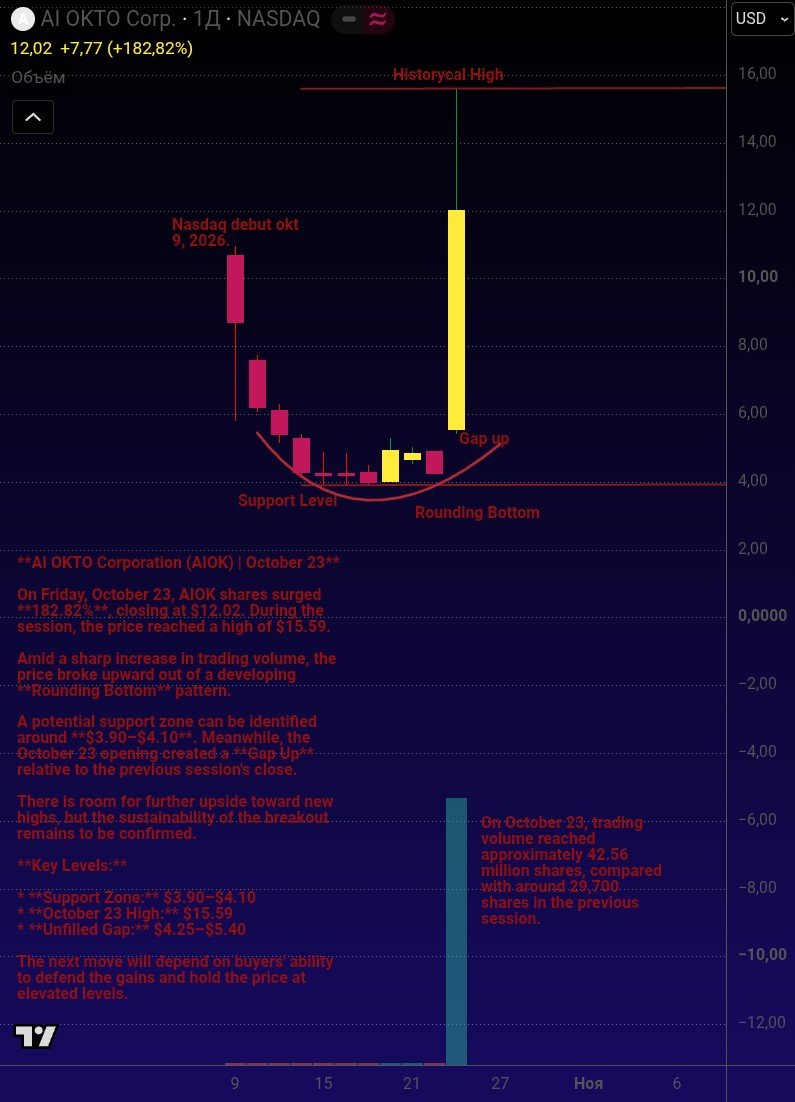
↗️ US Top Gainer of the Week 🇺🇸
$AIOK · $12.02 · +186.2% w/w
Vol×Price: ~$470M · Cap: $52M
Volume: 42.8M sh — ~120x prior week, ~38x float
Catalyst: Oct 23 – one-time $3.50/sh special dividend (~82% of prior close $4.25), cash or stock; record Nov 2, payment ~Nov 25, shares trade with due bills. Same morning: sale of LPG carrier Dream Arrax for $18M to Robin Energy $RBNE, controlled by AIOK's CEO.
About: Cyprus-based LPG shipowner, spun off from Toro Corp $TORO; Nasdaq debut Oct 9, 2026. Fleet: two 2015-built 5,000 cbm LPG carriers, one after the sale. H1'26 revenue $4.2M.
Watch / Risks: float ~1.1M, CEO ~74% · stock should drop by ~$3.50 on the ex-date (expected Nov 26) · $500M F-3 shelf filed Oct 20 · after-hours Fri −18…−23%
NFA
Bitcoin Faces Resistance After +45% Rally — Key Battle at 81k.
After reaching 87,000, Bitcoin bulls met strong bearish resistance and failed to hold above that level.Following a powerful advance from 60,000 (+45%), the bulls were forced to retreat to Support zone 1 around 81,000, still preserving +35% from the low and roughly 78% of the total gain.They then attempted to reclaim lost ground and pushed to 84,000 (+3.7%), recovering exactly half of the previous drop. However, they could not hold the level and were pushed back to 81,000 once again.Bears are now pressing to break Support zone 1. Their next target is Support zone 2 near 78,000 (−3.7%). A successful breakdown would allow them to reclaim another portion of previously lost territory.Resistance zone: 84–85k
Support zone 1: ~81k
Support zone 2: ~78–79k
I don’t know how other traders handle big mistakes and capital losses, but I always want to reboot afterward — coffee, play the synthesizer, or just watch random videos. I know that’s probably a weakness. But we’re here to get stronger every day. As Mark Douglas said: 'To become a profitable trader, you need to become a better version of yourself.'
#TradingPsychology #MarkDouglas)
Trading Journal #3.
Mistake: Opened long on XAG (10D timeframe) but ignored the 1H where a bearish engulfing pattern was forming with the trend. Averaged down on the pullback against the 1H pattern. Result: −1.5% on the account.Also checked oil — daily retest short pattern + weekly engulfing forming — and went against both. Was tempted by the oil chart, rising volumes and the low price.Dumb mistakes after 10 years of trading. We all make them — veterans and beginners. The key is constantly analyzing your errors.
Back in 2017 I had exactly $5,000 in cash — the price of Bitcoin at the time.I had a clear choice: buy it or start day trading.I understood that buying Bitcoin is investing. It wouldn’t turn me into a trader. To become one you have to trade every single day and study technical analysis.That’s what I did. Almost 10 years and over 1,000 trades later, I don’t hold Bitcoin as an asset. I trade its volatility.Average intraday return: 2%.My experience lets me profit from its moves by going long and short.
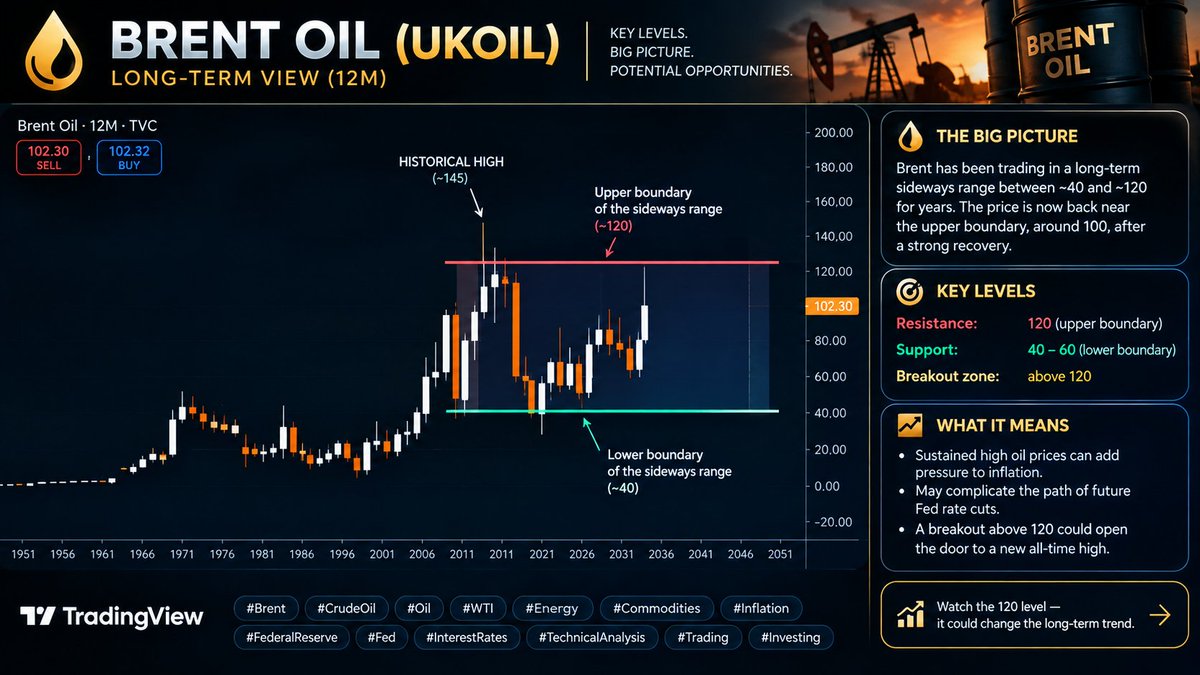
Brent Oil — A Long-Term Breakout Setup? 🛢️
Looking at Brent on the 12M timeframe, we can clearly see a long-term sideways range that has been developing between roughly $40 and $120.
After a powerful recovery from the lower boundary, oil is now trading around $100, approaching the upper boundary of this multi-year range.
The key question is whether this resistance will once again force a rejection — or whether Brent is finally preparing for a breakout above $120.
From a macro perspective, sustained strength in oil prices could add pressure to inflation and potentially complicate the path of future Fed rate cuts.
The current structure is especially interesting because the market is approaching a major long-term resistance zone. A confirmed breakout above $120 could completely change the long-term technical picture and open the door toward a new all-time high.
Key levels:
🟢 Support: $40–60
🔴 Major resistance: $120
🚀 Breakout zone: above $120
The next major move could define the direction of the next cycle.
#Brent #CrudeOil #Oil #WTI #Energy #Commodities #Inflation #FederalReserve #Fed #InterestRates #TechnicalAnalysis #PriceAction #Trading #Investing #Macro
Gold (XAUUSD) — Weekly Structure
Since April, gold has been in a prolonged correction, declining for 17 consecutive weeks before reaching the 4,000 area.
At that level, a strong Frying Pan / Saucer Bottom pattern began to form, marking a potential long-term accumulation zone. From this structure, gold managed to rally sharply toward 4,700.
The subsequent pullback has now brought price back into the area of the original formation.
What makes the current setup interesting is the retest of the Frying Pan bottom. Price is showing a potential reaction from this key zone, creating an area worth watching for a possible long setup, subject to confirmation.
Key levels to watch:
🟢 Support: 4,000–4,200
🔴 Resistance: 4,700–4,900
📈 Confirmation: bullish reaction and reclaim of key levels
The structure is developing — now the reaction at support is the key.
#Gold #XAUUSD #GoldTrading #GoldPrice #TechnicalAnalysis #PriceAction #Trading #Forex #Commodities #Investing #TradingView #Bullish #SupportAndResistance #MarketAnalysis #GoldAnalysis
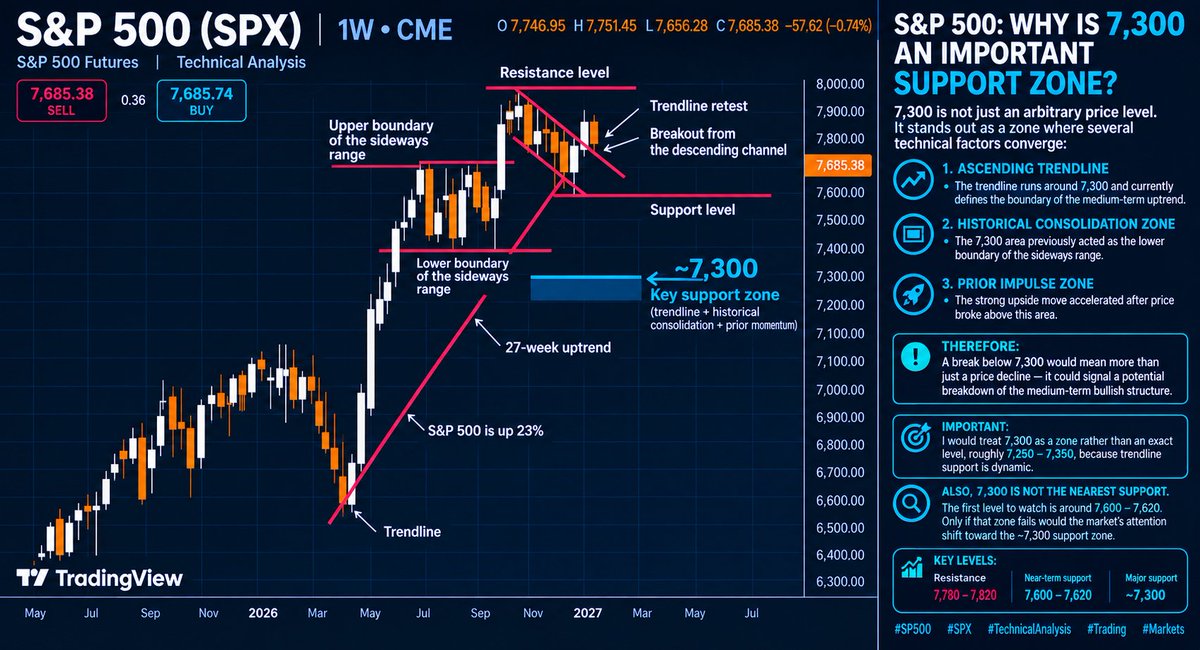
🇬🇧 S&P 500 — Why is 7,300 an important support zone?
7,300 is not just an arbitrary price level. It stands out as a zone where several technical factors converge:
🔹 Ascending trendline — the trendline runs around 7,300 and currently defines the boundary of the medium-term uptrend.
🔹 Historical consolidation zone — the 7,300 area previously acted as the lower boundary of the sideways range.
🔹 Prior impulse zone — the strong upside move accelerated after price broke above this area.
Therefore, a break below 7,300 would mean more than just a price decline — it could signal a potential breakdown of the medium-term bullish structure.
⚠️ Important: I would treat 7,300 as a zone rather than an exact level, roughly 7,250–7,350, because trendline support is dynamic.
Also, 7,300 is not the nearest support. The first level to watch is around 7,600–7,620. Only if that zone fails would the market's attention shift toward the ~7,300 support zone.
Key levels:
Resistance: 7,780–7,820
Near-term support: 7,600–7,620
Major support: ~7,300
#SP500 #SPX #TechnicalAnalysis #Trading #Markets