Celebrate 5.5 Million Users with $10,000 Giveaway🎉.
Join us in celebrating a major milestone! We're giving away $10,000 split among 100 lucky winners!
How to Enter:
✅Follow @the_yescoin on X.
✅Subscribe to our channel: https://t.co/BCZ4FkPH9h
✅Actively play our app: https://t.co/2VXmvLL2du
✅Tag at least 5 friends.
more tags, more chances to win!
🗓️Draw Date: June 25.
Don't miss out❗️
Good luck everyone🍀
#yescoin #realyescoin #giveaway
Linear Regression is one of the most important tools in a Data Scientist's toolbox. Here's everything you need to know in 3 minutes.
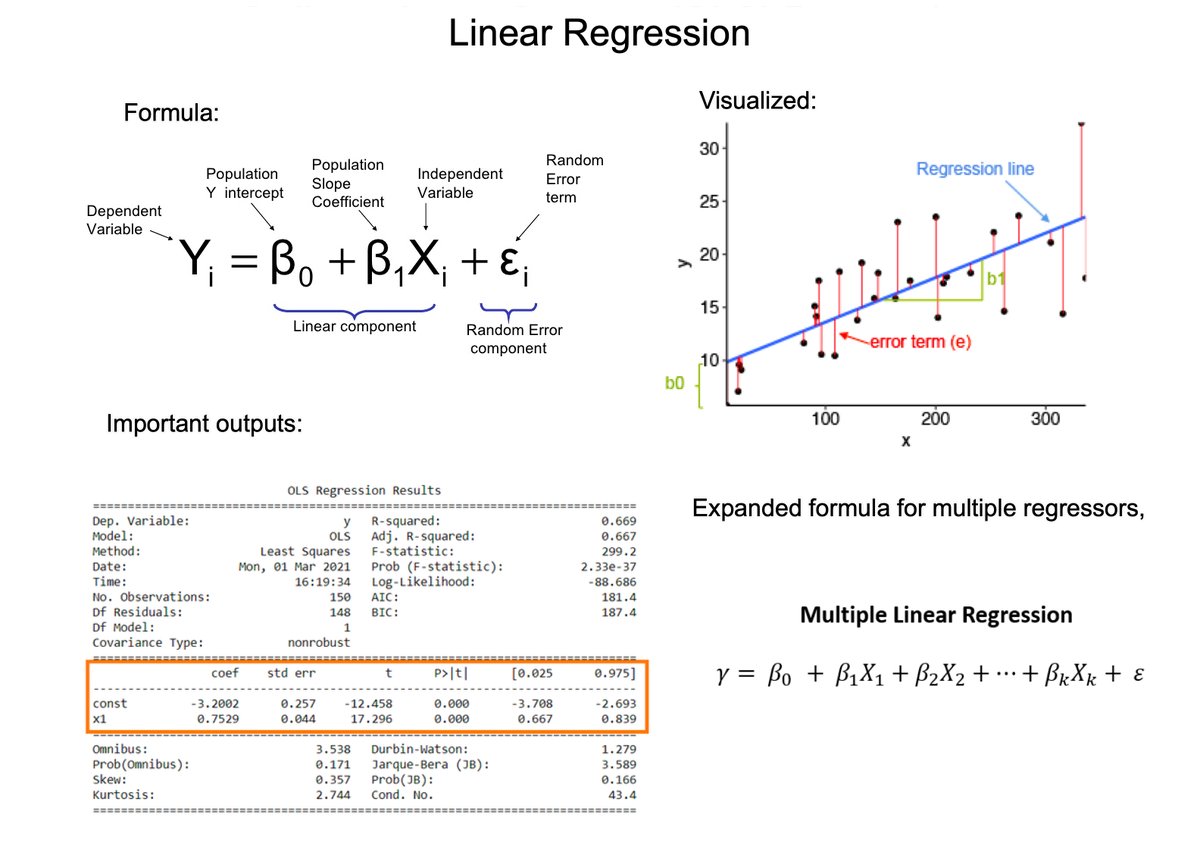
1. Ordinary Least Squares (OLS) Regression: Aims to find the best-fitting linear equation that describes the relationship between the dependent variable (often denoted as Y) and independent variables (denoted as X1, X2, ..., Xn).
2. OLS does this by minimizing the sum of the squares of the differences between the observed dependent variable values and those predicted by the linear model. These differences are called "residuals."
3. "Best fit" in the context of OLS means that the sum of the squares of the residuals is as small as possible. Mathematically, it's about finding the values of β0, β1, ..., βn that minimize this sum.
4. Slopes (β1, β2, ..., βn): These coefficients represent the change in the dependent variable for a one-unit change in the corresponding independent variable, holding other variables constant.
5. R-squared (R²): This statistic measures the proportion of variance in the dependent variable that is predictable from the independent variables. It ranges from 0 to 1, with higher values indicating a better fit of the model to the data.
6. t-Statistics and p-Values: For each coefficient, the t-statistic and its associated p-value test the null hypothesis that the coefficient is equal to zero (no effect). A small p-value (< 0.05) suggests that you can reject the null hypothesis.
7. Confidence Intervals: These intervals provide a range of plausible values for each coefficient (usually at the 95% confidence level).
Understanding and interpreting these outputs is crucial for assessing the quality of the model, understanding the relationships between variables, and making predictions or conclusions based on the model.
====
Want help improving your data science skills?
Free 10 Skills Webinar: I put together a free on-demand workshop that covers the 10 skills that helped me make the transition to Data Scientist: https://t.co/LR39RJ5XKB
10X Faster Projects w/ ChatGPT: I have a live workshop where I'll share how to use ChatGPT for Data Science (so you can complete projects 10X faster): https://t.co/EaMpKrJiqX
If you like this post, please reshare ♻️ it so others can get value.
How To Make $1000 a Month?
ChatGPT allows anyone to start building passive income fast.
Here are 15 ways to start building passive income with AI & earn $$$$
Free Certification Courses to Learn Data Analysis:
📍Data Analysis with Python
https://t.co/IrAzjIUzYs
📍Google Data Analytics
https://t.co/xTplHt4n0D
📍Data Analyst Bootcamp
https://t.co/1R725zvLQp
📍Data Analysis with Python
https://t.co/hmag822sN9
📍The Analytics Edge (Spring 2017)
https://t.co/JZL0TCX1tD
📍Data Analysis with Python: Zero to Pandas
https://t.co/QKqnMD0CcN
📍Introduction to Data Analytics with Python
https://t.co/R2dFONxloB
📍Guide to Excel Tables and Functions
https://t.co/y8T5KC7Tkc
📍Introduction to R Programming
https://t.co/qVrDJkWDdo
📍Introduction to Data Analytics and Python Fundamentals
https://t.co/bmeSRQHsRz
Follow @Kanojiyaaakash1 for such free resources.
R is a powerful and versatile programming language designed for data analysis and visualization. It’s widely used by statisticians, data scientists, and researchers to analyze, visualize, and interpret complex datasets. https://t.co/fhXkv4vA75
#DataScience#dataviz#coding
Free Python & Data Analytics courses on LinkedIn:
1. Introduction to Programming
https://t.co/vdpbBlhYWs
2. Introduction to Python
https://t.co/8F1Ba1hjIX
3. Advanced Python
https://t.co/n1r9tUKt1z
4. Introduction to Data Analytics
https://t.co/89zcSADwtA
5. Data Analytics - Foundations
https://t.co/JwLsNhYzX5
6. Data Analytics - Advanced
https://t.co/RcWdZi6sh4
7. Managing Data
https://t.co/07HYggOfnk
Generalized Linear Models (GLM) - Simplified! 📊
💎 Intro to GLM
You know how in school we learned about straight lines (y = mx + b)? GLM is like that, but for more complex relationships in data. It’s a mathematical magician!
💎 Why Not Just Linear Models?
Imagine trying to fit a straight ruler on a curvy path. It doesn't always work, right? Life isn't always straight, and neither is data. GLM lets us handle those curves!
💎 Three Magic Parts of GLM:
1. The Link: This is a function that "straightens" our response variable, making it easier to model.
2. Linear Predictor: Our good old straight line equation, but jazzed up with more variables.
3. Probability Distribution: Tells us how our data is spread. It could be normal (like a bell curve), binomial (like a coin toss) or many others.
💎 Real World Example
Suppose we want to predict if a customer will buy (yes or no). A GLM can handle this "binary" outcome and tell us how different factors (age, preferences) influence that decision.
💎 Predicting Many Outcomes
Sometimes we don't just predict 'yes' or 'no'. Like predicting if a fruit is ripe, overripe, or underripe. GLMs are versatile and can handle these scenarios!
💎 Benefits of GLM:
1. Flexibility with different types of data.
2. Handles complex relationships.
3. Provides insights into which factors are influential.
💎 Different Flavors of GLM
Depending on our data, GLMs can come in several styles:
• Logistic: Predict binary outcomes, like 'win' or 'lose'. It's all about odds.
• Poisson: Counting stuff? Like number of emails you get daily? Poisson's your go-to.
• Normal: Good ol’ classic, for continuous data like heights or weights.
• Gamma: Useful for positive continuous values, like the time between events.
💎 Assumptions? Yep, GLM Has Those!
Just like superheroes have weaknesses, GLMs have assumptions:
• Correct Link Function: We pick a link based on our data's distribution.
• No Multicollinearity: Our predictor variables shouldn't be too related to each other.
• No Overdispersion: For count data, if variance > mean, it's a sign we might need to adjust our model (maybe a Negative Binomial Regression).
• Independence: Observations should be independent.
💎 GLM vs. Other Models
Why not just use another model? GLMs are a middle ground. They're more flexible than basic linear models but less complex than neural networks. They're the versatile multitool in a statistician's toolkit!
💎 Interpretation & Insights
After fitting a GLM, you get coefficients. Each coefficient tells how much a factor influences the outcome. Positive? It increases the chances. Negative? Decreases them. Size? Shows the strength of influence.
💎 In Summary
Think of GLM as the Swiss Army knife for data analysis. It can handle curves, twists, and various outcomes. So next time data isn't playing nice and straight, remember GLM might just be your answer!
Happy modeling and remember, life isn't linear, but with GLMs, we can navigate the curves! 📊🧮
#Statistics #GLM #DataScience
Best AI tools to level up your Life 🚀
1. https://t.co/5PUEdne8l4 - AI Youtube Summaries
2. https://t.co/5PVYC566rU - AI Writing
3. https://t.co/NvTCeCd25C - AI Images
4. https://t.co/9bQ85HLKps - AI Meetings
5. https://t.co/BKAJ2q5eFe - Prompts
6. https://t.co/dWY4roA67j - AI Audio
7. https://t.co/WLfsljZyIW - AI Videos
8. https://t.co/CjXYfabQyC - AI Workspace
9. https://t.co/UvsQMCjfTV - AI Live meet transcription
[Bookmark 🔖 for later!!!]
ChatGPT is old news.
Now, You can create custom-branded AI chatbots trained on your data
With ZERO code and in a few minutes
(Yes, it’s actually possible!)
Here's how: