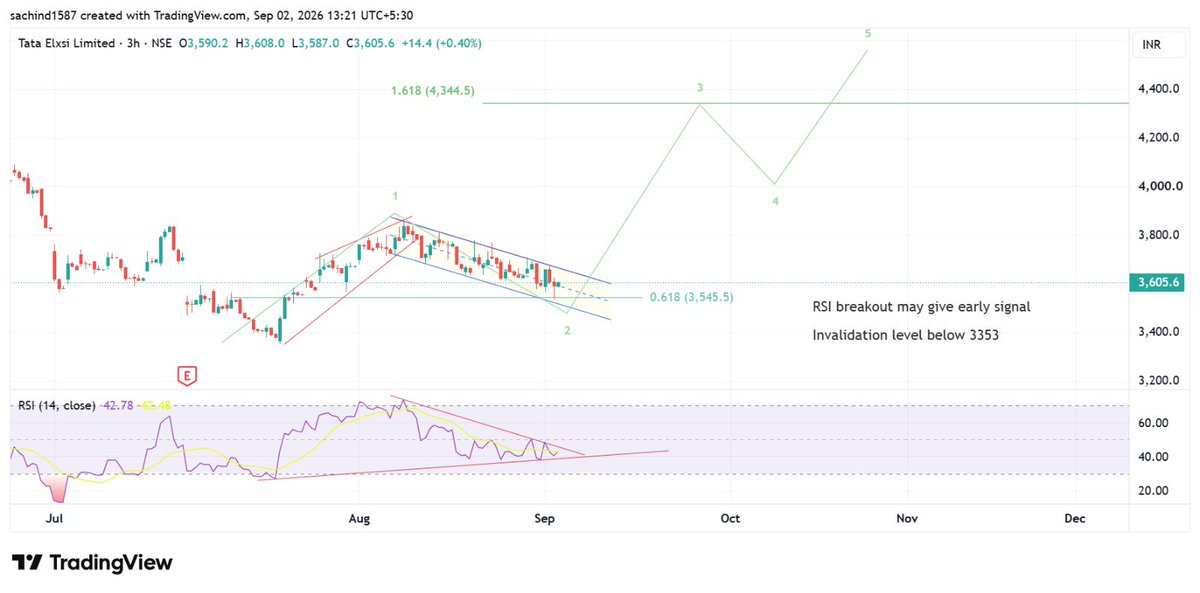
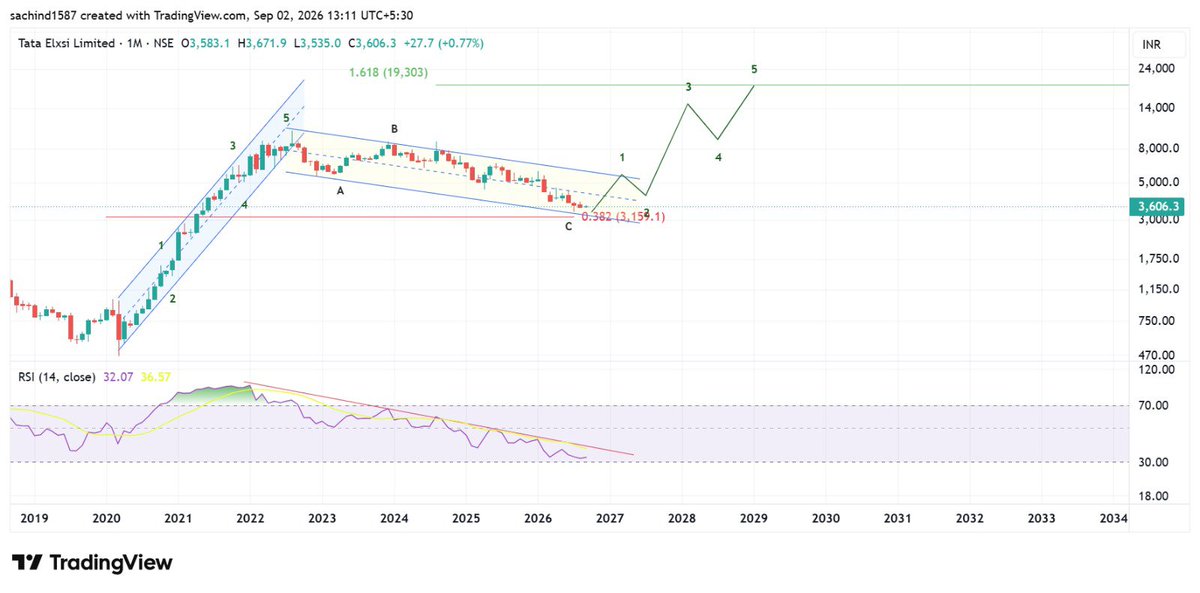
Tata Elxsi
CMP ₹3,606 📊 — 3H & Monthly charts show a potential bullish reversal setup; RSI breakout could confirm the next 5-wave move, with ₹3,353 as key invalidation.
#TataElxsi#NSE#ElliottWave#TechnicalAnalysis#SwingTrading
Websol Energy
Weekly + 3H 📊 CMP ₹77.8 — Strong confluence at long-term channel & 0.5/0.618 Fib support; waiting for price/RSI trendline breakout for confirmation of Wave 5.
#Webelsolar#NSE#SwingTrading#ElliottWave#TechnicalAnalysis
SEPC |
CMP ₹5.76 📊
Long-term charts have high accuracy, and this chart is following the Elliott Wave theory remarkably well—watching closely for the next major move.
#SEPC#NSE#LongTerm#ElliottWave#TechnicalAnalysis
Hindustan Copper
Weekly + 3H 📊
CMP: ₹572.65
Wave (4) appears to be nearing completion, with a breakout above recent highs likely to trigger the next bullish Wave (5).
Charts reflect my personal analysis, not investment advice.
#HindCopper#NSE#ElliottWave#Technical
Varun Beverages |
3H + Weekly 📊
CMP ₹430; holding the ₹417–412 Fibonacci/confluence support with potential ABC completion; bullish reversal above ₹447 could open ₹480 → ₹520, while ₹379.75 remains the key invalidation.
#VBL#NSE#SwingTrad#ElliottWave#Technical
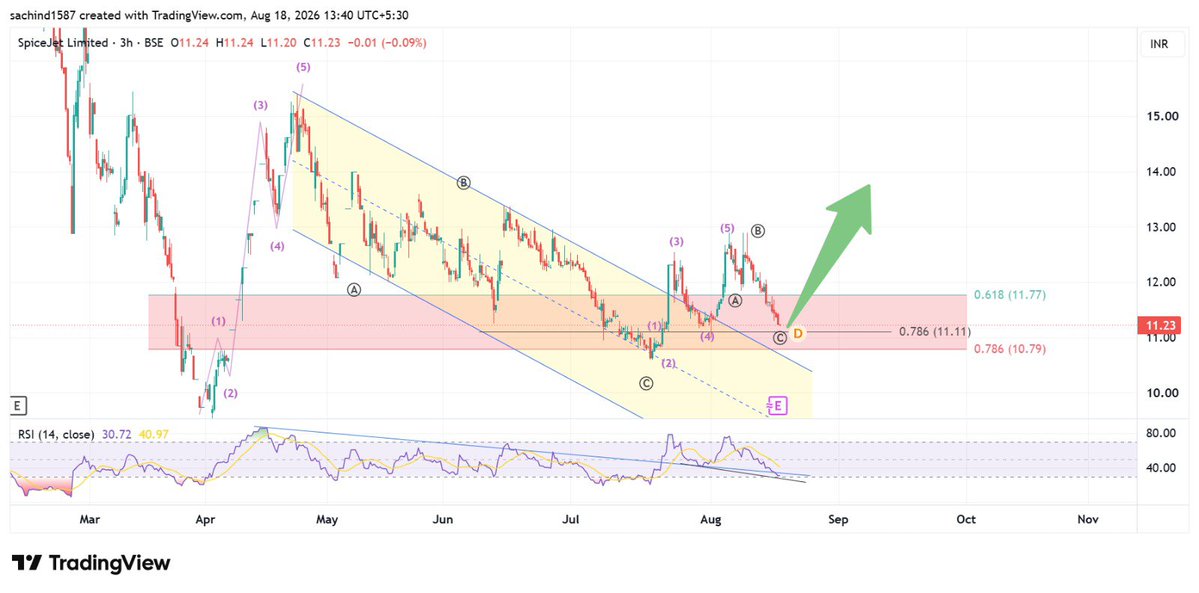
SpiceJet | 3hr + Monthly + Weekly 📊 |
CMP: ₹11.24
Price is holding a strong confluence support (0.618–0.786 Fib) with RSI turning up, keeping the probability of a bullish C-wave/impulse reversal alive above ₹9.53. #SpiceJet#NSE#BSE#PriceAction#ElliottWave#Technical
Hindustan Copper
Weekly + 3H 📊
CMP: ₹572.65
Wave (4) appears to be nearing completion, with a breakout above recent highs likely to trigger the next bullish Wave (5).
Charts reflect my personal analysis, not investment advice.
#HindCopper#NSE#ElliottWave#Technical
Idea
Weekly + 3H 📊
Bullish momentum is building after a breakout from the falling channel on the 3H chart, while the weekly structure continues to support a larger Elliott Wave move.
Charts reflect my personal analysis,not investment advice.
#Idea#IDEA#NSE#ElliottWave
NCC Ltd.: Weekly chart is sitting at a high-confluence support (0.5 Fib + channel support) with RSI retesting breakout trendline. A weekly close above ₹146 strengthens the bullish case.
CMP : 142
#NCC#ElliottWave#TechnicalAnalysis#NSE