#NatGas Weather Update | Sep 29
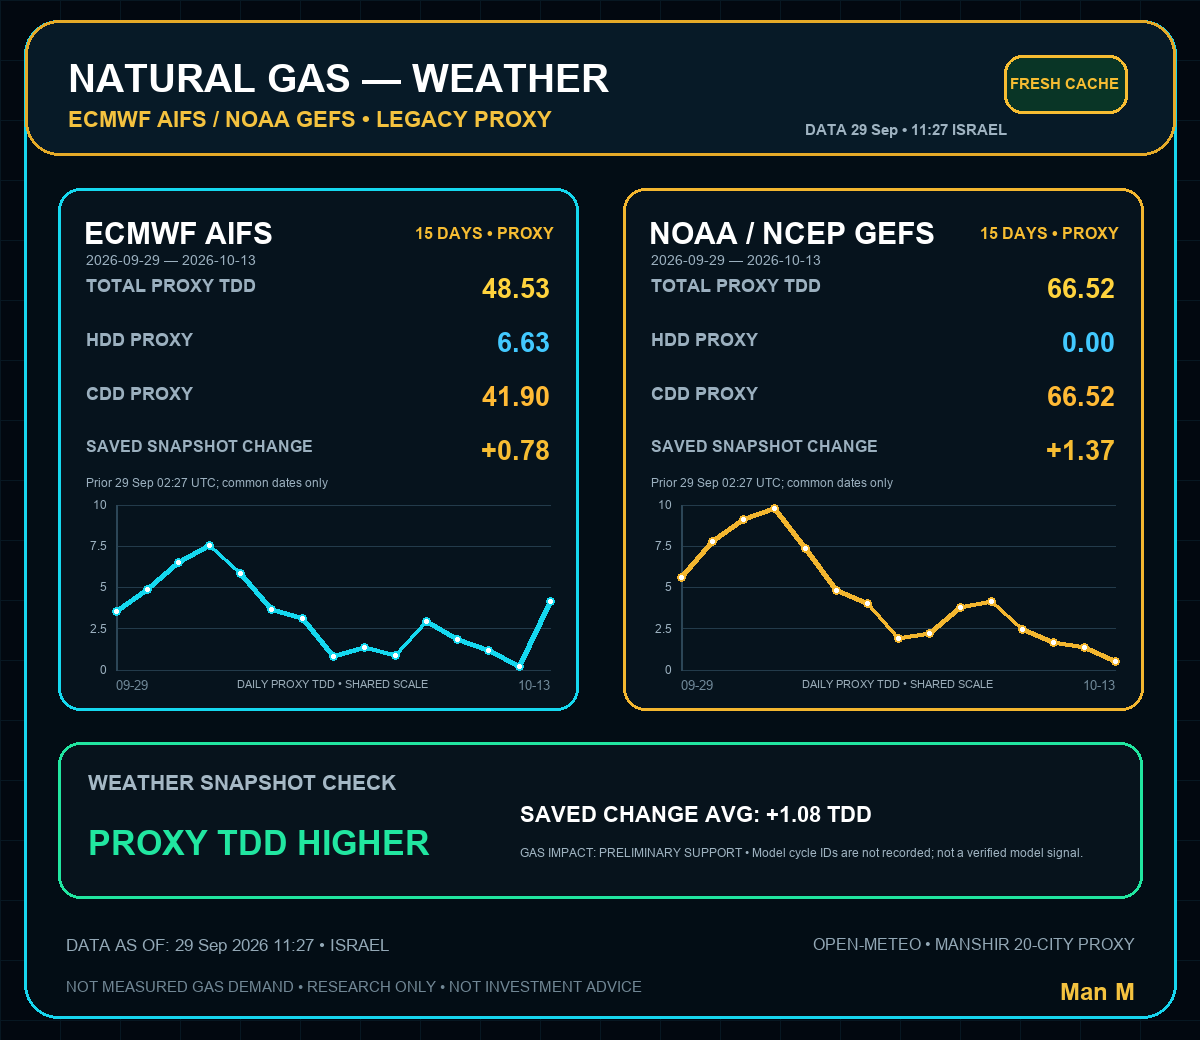
Both weather proxies moved slightly higher in the latest update:
ECMWF AIFS: +0.78 TDD
NOAA/GEFS: +1.37 TDD
Average change: +1.08 TDD
That’s a modestly supportive weather revision, but not a major bullish signal yet.
The key detail: demand is still dominated by CDD rather than HDD. We are still in the shoulder-season transition, not a true heating-demand regime.
For me, the next important signal is not simply “more TDD” — it’s whether the models begin adding persistent HDDs as we move into October.
Current weather bias: Slightly Bullish 🟢
Confidence: Low–Moderate
Proxy model data — not measured gas demand.
MANSHIR MARKETS | Natural Gas Research
#NaturalGas #NG #Weather #ECMWF #GEFS
#NatGas Weather Update
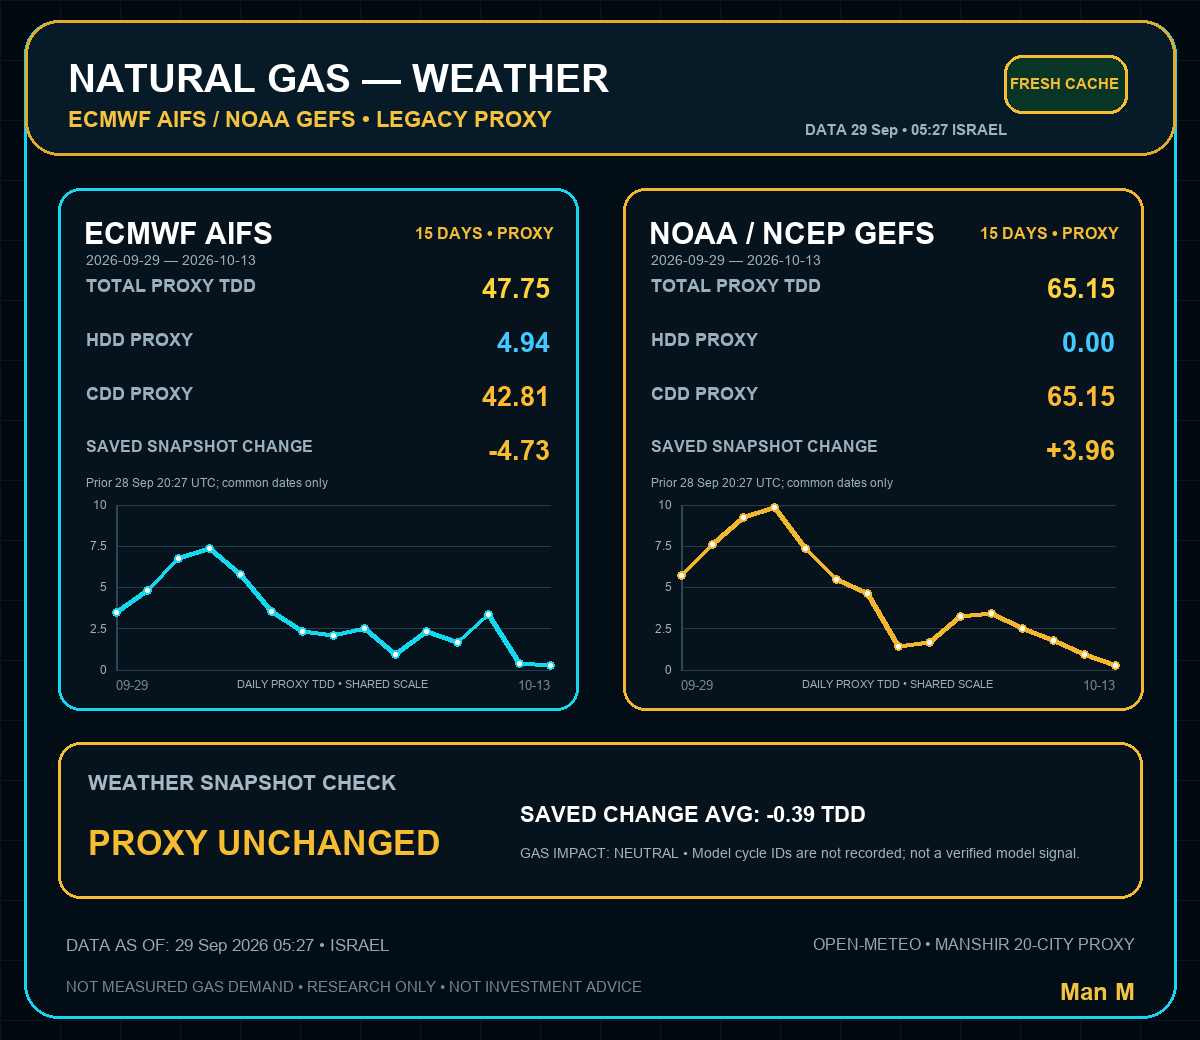
ECMWF AIFS and NOAA/GEFS are sending mixed signals this morning.
ECMWF AIFS: 47.75 TDD, change −4.73
NOAA/GEFS: 65.15 TDD, change +3.96
Average saved change: −0.39 TDD
Net result: weather proxy remains essentially neutral. One model weakened while the other improved, leaving no clear directional edge for gas demand at this stage.
For now, this is a wait-for-confirmation setup rather than a strong weather-driven signal.
#NaturalGas #NatGas #NG #Weather #ECMWF #GEFS #EnergyTrading #ManshirMarkets
Qatar LNG deliveries to Edison halted until early December; six more cargoes cancelled. Edison has sourced replacements mainly from the US. Bullish for winter US LNG demand support; extra Henry Hub feedgas is not confirmed.
Sure 🙂
This is just a quick snapshot of the main Natural Gas drivers.
EIA tells us how much gas is going into storage and whether inventories are high or low versus normal.
CFTC shows how large traders are positioned — more long or short.
The futures curve tells us whether later contracts are more expensive than the front month.
ECMWF and GEFS are weather models — higher TDD generally means stronger heating/cooling demand.
I combine all of these factors to understand whether the overall setup is more bullish or bearish. It’s not magic — just several signals put together 🙂
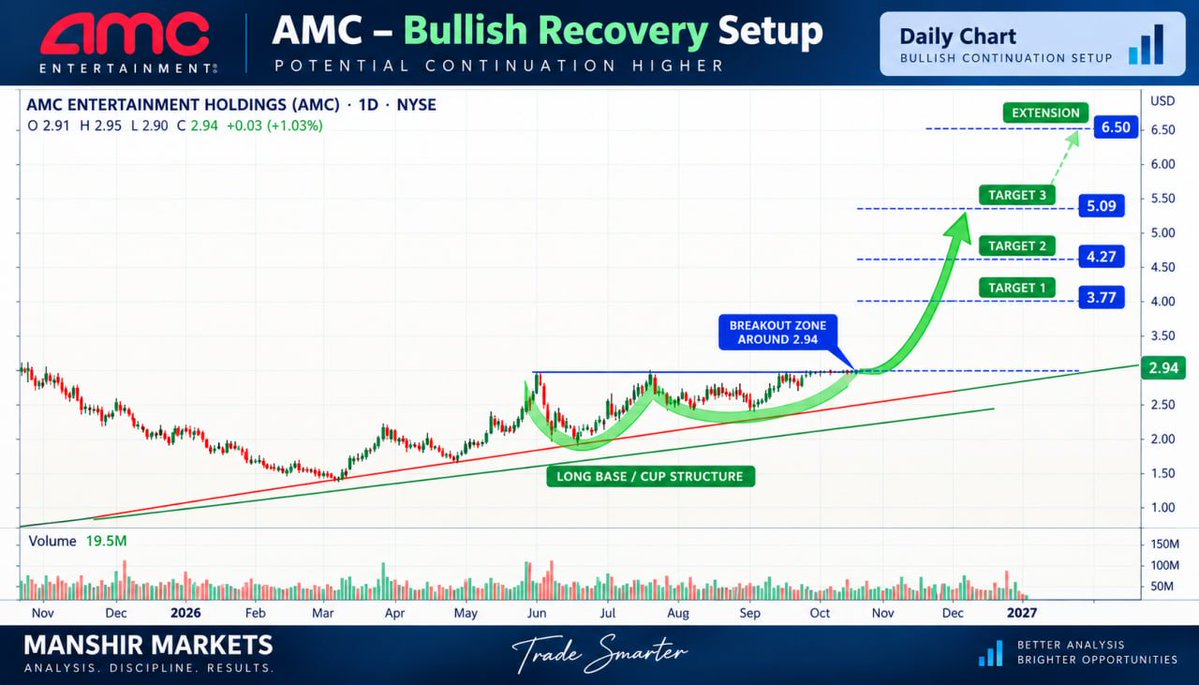
AMC has been building a long, rounded base (often described as a cup or multi-month accumulation structure) along rising trendlines, and price is now testing the neckline / breakout zone near $2.94.
What the charts are saying
Structure: After the 2025–early 2026 decline, price formed a wide rounding bottom with higher lows along the red/green ascending support lines. The second chart overlays a cluster of short- and long-term moving-average “heat map” bands that have flattened and begun to curl up underneath price — typical of a base that’s tightening.
Breakout level: Both charts mark ~$2.94 as the horizontal resistance that has capped several rallies since June. A daily close and hold above that zone is the trigger they are watching.
Measured targets (typical cup-height or Fibonacci-style projections from the base):Target 1: $3.77
Target 2: $4.27
Target 3: $5.09
Extension: $6.50
These are pattern-based projections, not forecasts. Volume on the first chart has been relatively muted on the recent grind higher, which is common in a base but means a convincing breakout usually wants an expansion in volume.
Current context (late September 2026)
AMC last closed at $2.94 (+1.03%), right at the level highlighted on both charts. Year-to-date the stock is up sharply from the $0.93–$1.56 lows, and it is trading above its 50-day ($2.58) and 200-day (~$1.82) moving averages. RSI on the daily is in the low-to-mid 60s — constructive but not yet overbought.
Fundamentally, the company has been refinancing a large portion of its secured debt (new first-lien notes and term loans priced in late September, expected to close around early October) and reported a record Q2 2026 on stronger attendance and premium formats. Analyst consensus remains mixed-to-cautious (average targets clustered around current price or modestly below), reflecting the still-high leverage and history of dilution.
Practical notes
A clean breakout would look like a strong close above $2.94–$3.00 on rising volume, followed by the old resistance acting as support.
Failure to hold the rising trendline or a rejection back under ~$2.70–$2.80 would keep the pattern in “base-building” mode rather than “breakout.”
AMC remains a high-beta, high-debt name; technical targets can be overtaken by news on box office, further capital raises, or refinancing terms.
The charts are illustrating a classic continuation setup that many technicians would watch for a measured move higher if the 2.94 zone is reclaimed and held. Whether that happens depends on follow-through volume and the company’s ability to keep improving cash generation. This is pattern analysis, not a recommendation.
AMC has been building a long, rounded base (often described as a cup or multi-month accumulation structure) along rising trendlines, and price is now testing the neckline / breakout zone near $2.94.
What the charts are saying
Structure: After the 2025–early 2026 decline, price formed a wide rounding bottom with higher lows along the red/green ascending support lines. The second chart overlays a cluster of short- and long-term moving-average “heat map” bands that have flattened and begun to curl up underneath price — typical of a base that’s tightening.
Breakout level: Both charts mark ~$2.94 as the horizontal resistance that has capped several rallies since June. A daily close and hold above that zone is the trigger they are watching.
Measured targets (typical cup-height or Fibonacci-style projections from the base):Target 1: $3.77
Target 2: $4.27
Target 3: $5.09
Extension: $6.50
These are pattern-based projections, not forecasts. Volume on the first chart has been relatively muted on the recent grind higher, which is common in a base but means a convincing breakout usually wants an expansion in volume.
Current context (late September 2026)
AMC last closed at $2.94 (+1.03%), right at the level highlighted on both charts. Year-to-date the stock is up sharply from the $0.93–$1.56 lows, and it is trading above its 50-day ($2.58) and 200-day (~$1.82) moving averages. RSI on the daily is in the low-to-mid 60s — constructive but not yet overbought.
Fundamentally, the company has been refinancing a large portion of its secured debt (new first-lien notes and term loans priced in late September, expected to close around early October) and reported a record Q2 2026 on stronger attendance and premium formats. Analyst consensus remains mixed-to-cautious (average targets clustered around current price or modestly below), reflecting the still-high leverage and history of dilution.
Practical notes
A clean breakout would look like a strong close above $2.94–$3.00 on rising volume, followed by the old resistance acting as support.
Failure to hold the rising trendline or a rejection back under ~$2.70–$2.80 would keep the pattern in “base-building” mode rather than “breakout.”
AMC remains a high-beta, high-debt name; technical targets can be overtaken by news on box office, further capital raises, or refinancing terms.
The charts are illustrating a classic continuation setup that many technicians would watch for a measured move higher if the 2.94 zone is reclaimed and held. Whether that happens depends on follow-through volume and the company’s ability to keep improving cash generation. This is pattern analysis, not a recommendation.
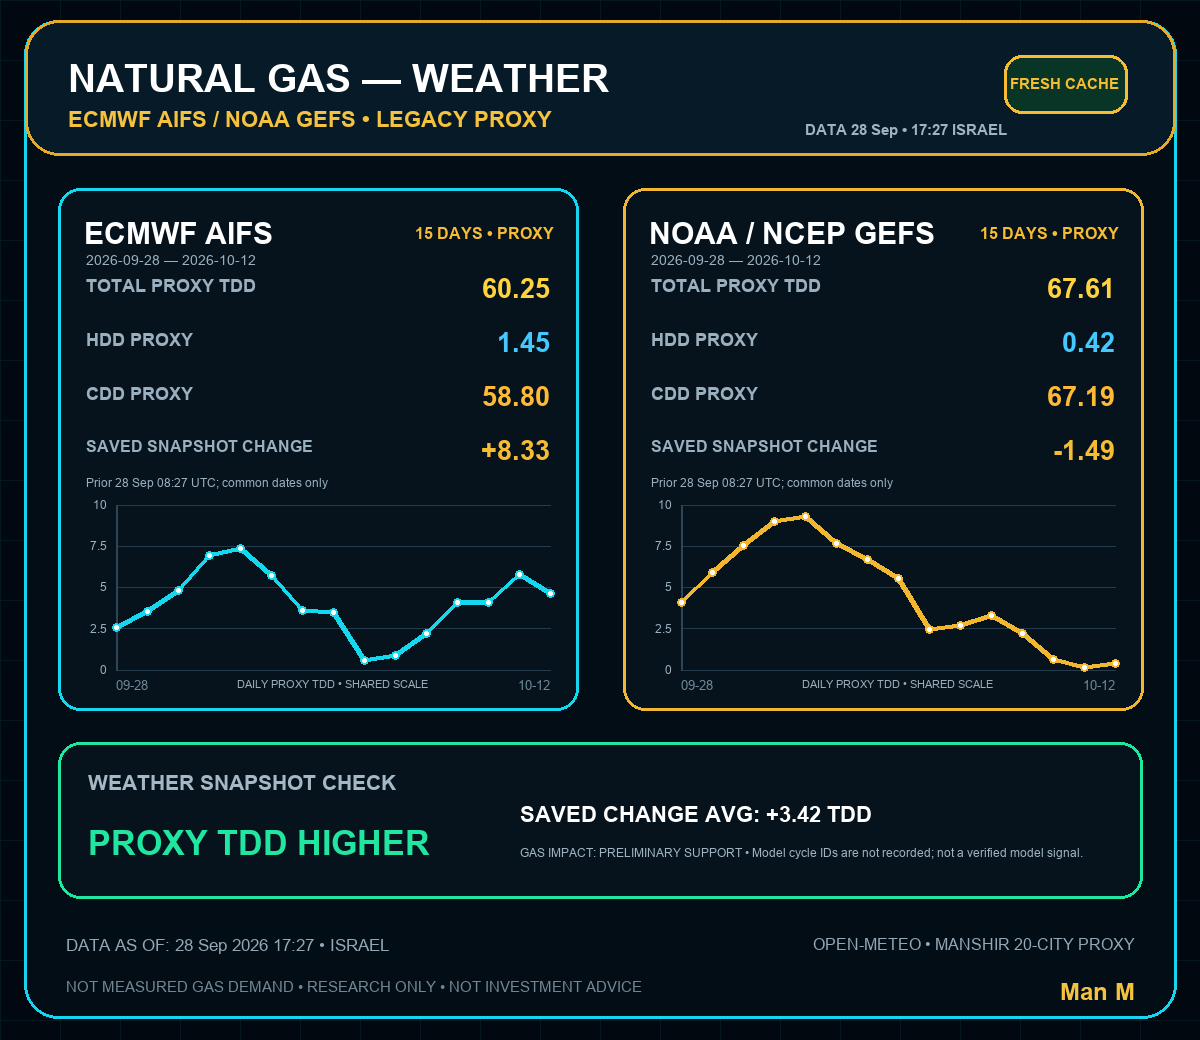
Natural Gas weather proxy: AIFS added +8.33 TDD, while GEFS lost -1.49 TDD. Average revision: +3.42 TDD — preliminary support for gas demand, but model signals remain mixed. Not an official cycle revision.
#NaturalGas#NatGas#Weather
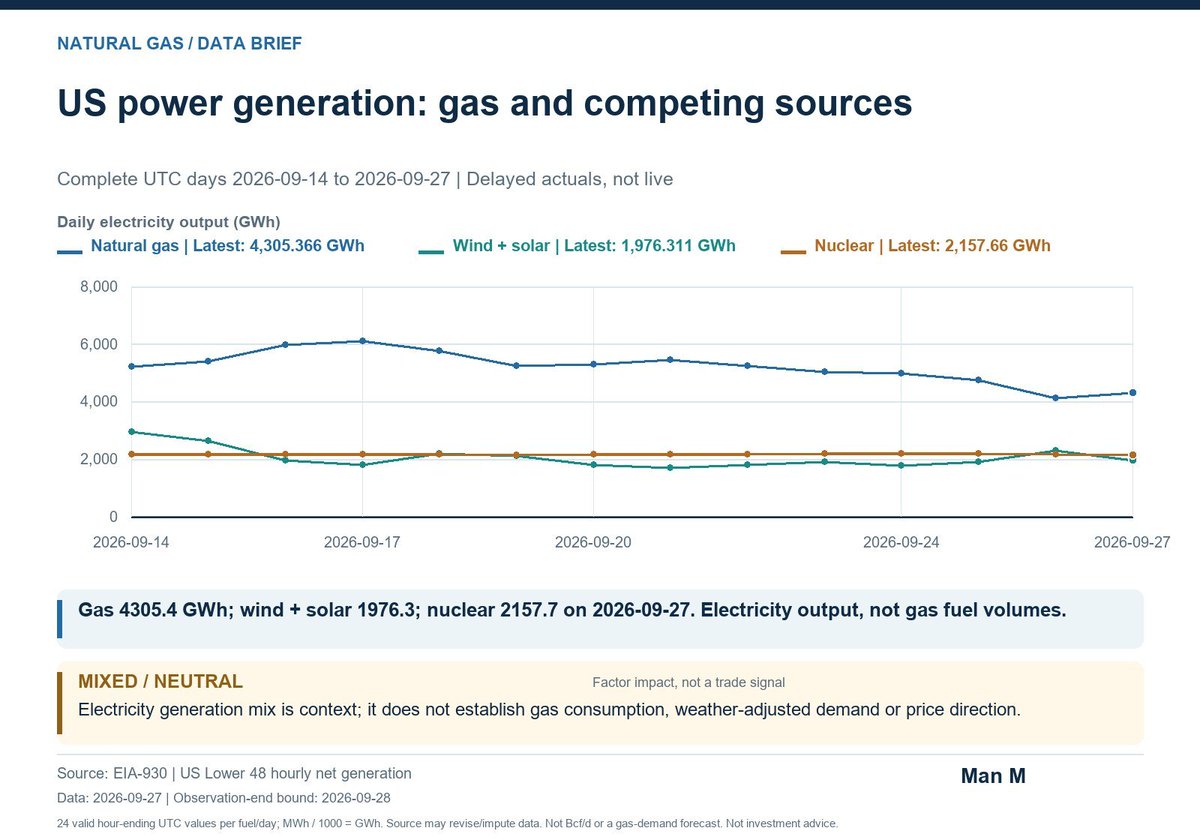
#NatGas US power mix: gas 4305.4 GWh, wind + solar 1976.3, nuclear 2157.7. Data 2026-09-27; complete UTC day, delayed EIA actuals. Electricity generation, not gas consumption or a trade signal.
#NatGas US power mix: gas 4350.9 GWh, wind + solar 2090.7, nuclear 2199.7. Data 2026-09-26; complete UTC day, delayed EIA actuals. Electricity generation, not gas consumption or a trade signal.
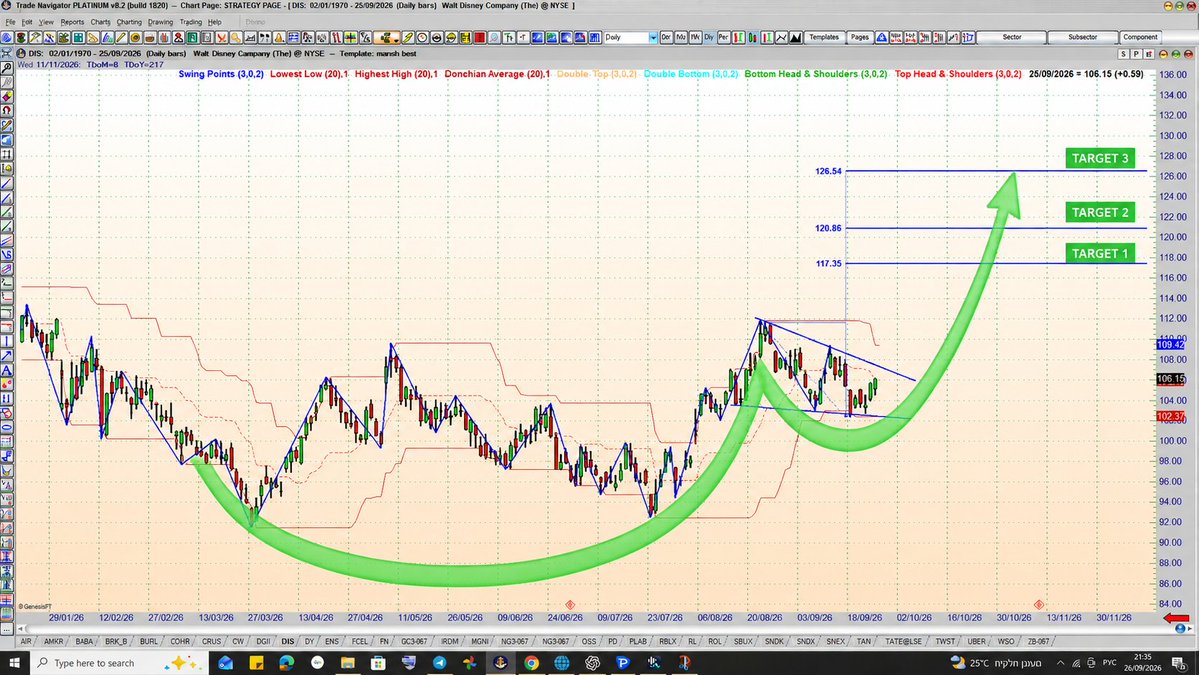
DIS is developing a Cup & Handle on the daily chart.
The cup is formed; the handle is still developing.
Price remains above the key 20 / 50 / 200 moving averages, keeping the medium-term structure constructive.
The key trigger is a confirmed breakout above the handle/flag. If confirmed, the next technical levels are:
🎯 117.35 → 120.86 → 126.54
Until then, this remains a setup awaiting confirmation — not a blind entry.
A news catalyst could provide the trigger.
MANSHIR MARKETS | Technical Analysis
#DIS #Disney #TechnicalAnalysis #Stocks
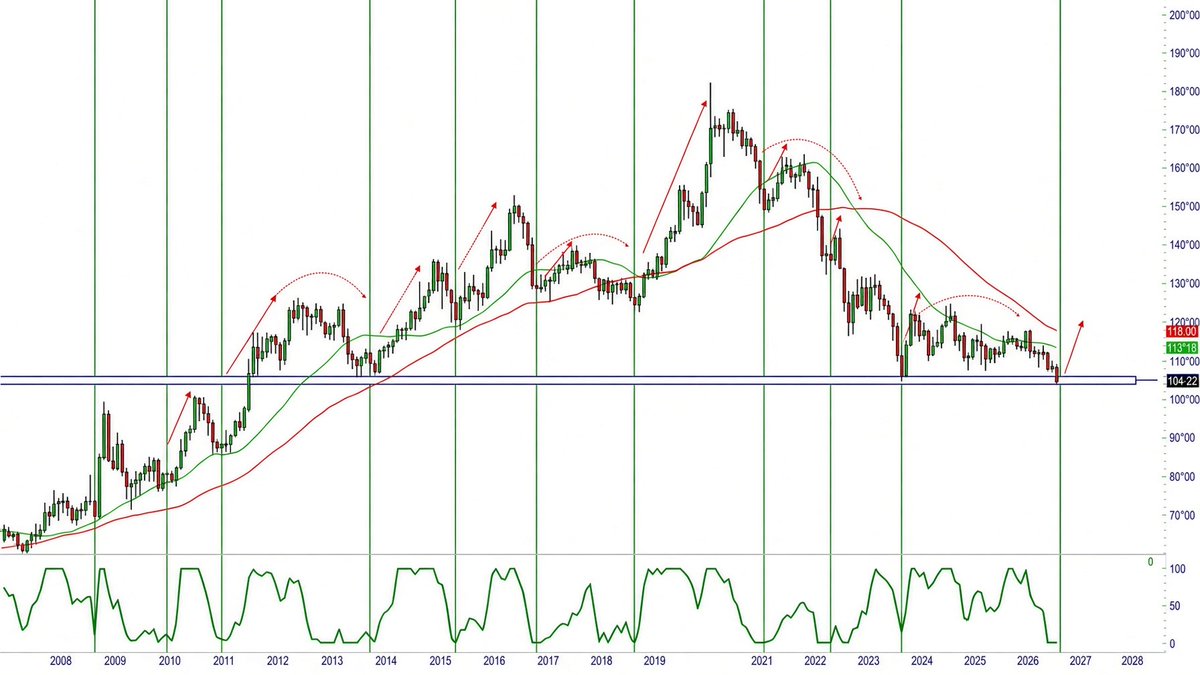
ZB 30Y at a major monthly level.
The oscillator keeps producing bounces from this same zone.
COT setup is constructive.
If the level holds, look to add a swing long and ride it.
#ZB#Treasuries#COT