@re_sieber I don't know the specifics, but it's disgraceful that they closed down one of the most used metro stations for a Biodiversity conference. Peasants gotta bow down I guess
These two articles both represent gender disparity in major orchestras in the US/world by instrument/section. It shows how powerful interactive visualization can be as it can aggregate so much data into a single chart.
https://t.co/CA9xl8LIPS
#neogeoweb
Soccer fans are being watched at the World Cup in Qatar using biometric technology. Is public safety a good justification for using such technologies?
https://t.co/W7RxAPIBc5 #neogeoweb
French Ministry of Education says no to Office365/google workspace in school due to privacy and data outsourcing concerns. https://t.co/bzaSK1MeE5 #neogeoweb
@joyjzhou For transit recommendations, I think I've heard somewhere Google maps uses API of transit agencies? Then there's a good chance they are feeding bad data. Correct me if i'm wrong #neogeoweb https://t.co/FJjimseFO8
@geogeo384 I respectfully disagree. It can't even contain fields of more than 10 characters, size of more than 2gbs, no coordinate definition for a spatial file.. File geodatabases or any other formats all the way #neogeoweb
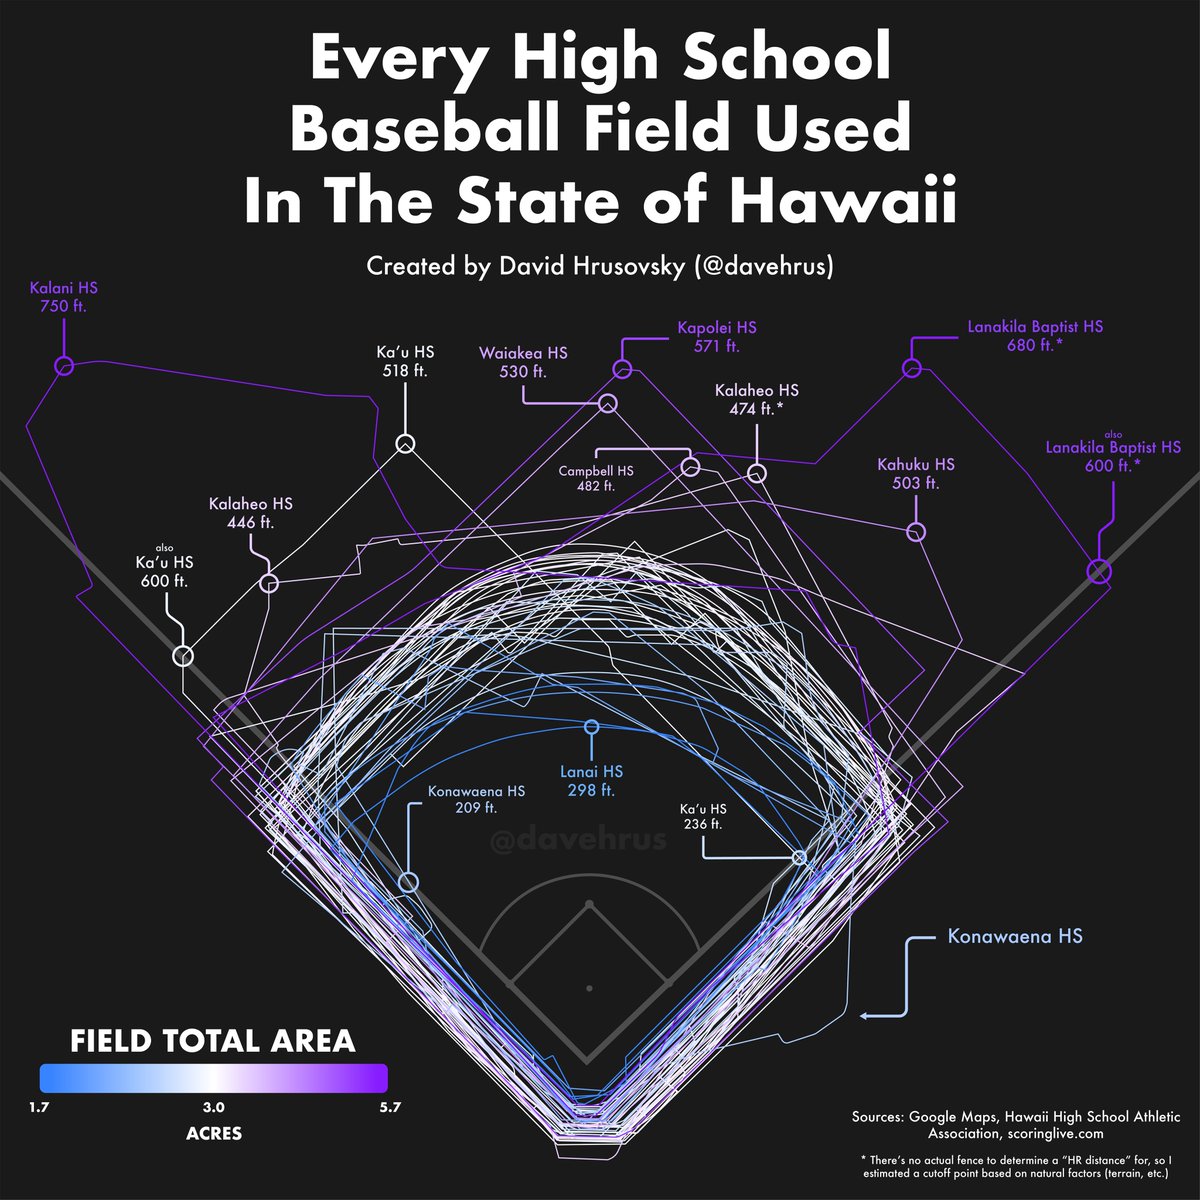
I plotted and outlined every single field used for official Hawaii high school baseball games. Here are all of them overlayed on top of each other. #Hawaii
We always need to keep in mind that we are often dealing with a wide range of audiences, and this is where the storytelling element comes into play to help less digitally literate people to understand complex visualizations. https://t.co/2SmjCdb8wW #neogeoweb
I just got an email from Reddit about the updates to their privacy policy. Even though I don't have much concern since I'm only a passive user, I'm curious to know why they aren't more explicit about what exactly they are changing. #neogeoweb
Baseball Savant is a wonderful website where it visualizes every element of data collected by Google Statcast during any big league games, year-round. https://t.co/bwXXMq2lAT #neogeoweb
Sports is one example where spatial data visualization is useful without all the cartographic elements. Here's an example of all the punts that occurred in the history of Pro Football and its analysis.https://t.co/9AqwTGqOd1 #neogeoweb