They haven’t stopped. ES futures on fire....
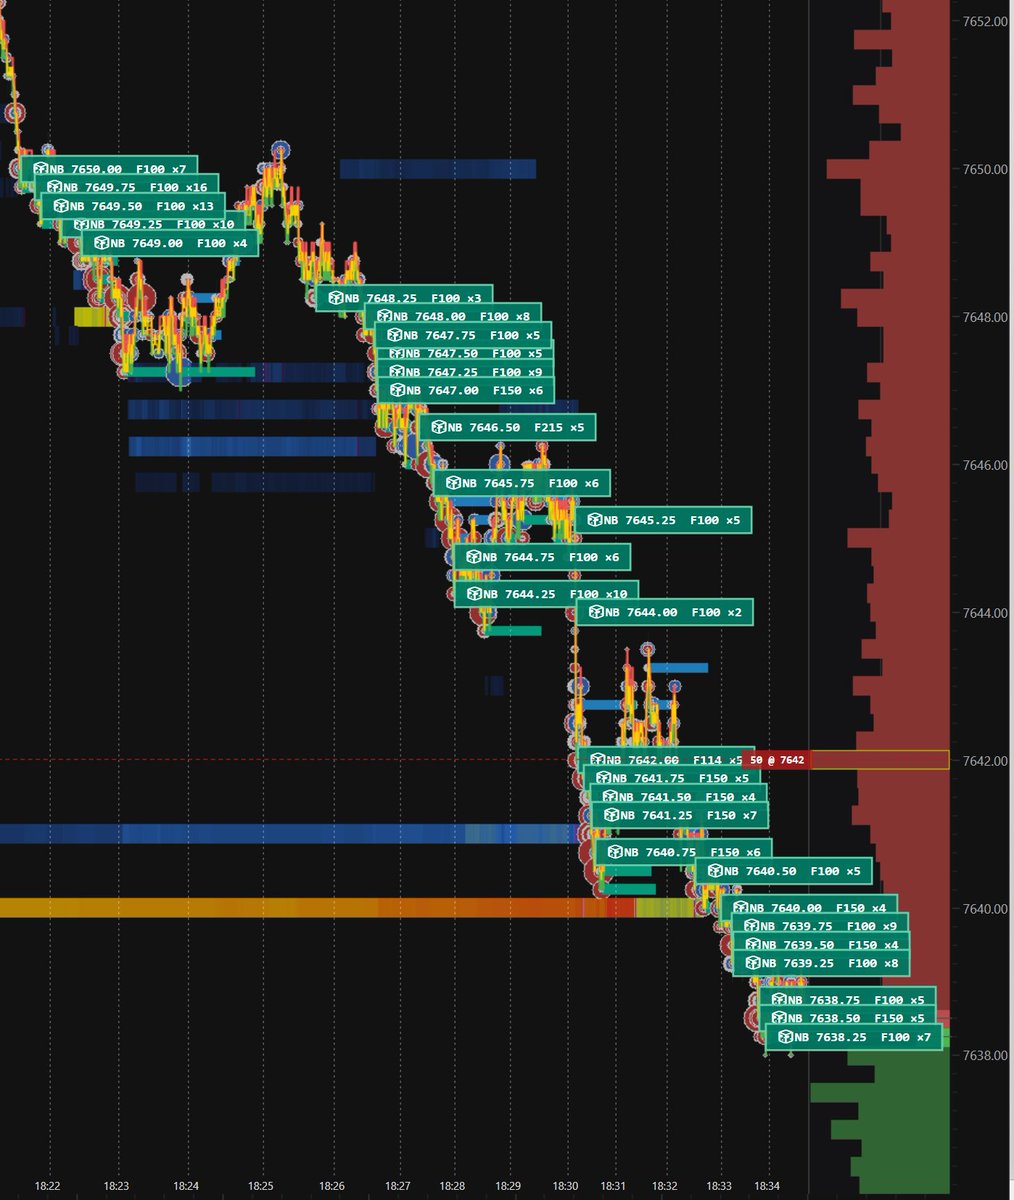
Buy icebergs continue to execute in size just before the midterms.
Large participants are still quietly working the bids, absorbing their full interest.
Ongoing accumulation into the event.
The hidden demand is still active.
RTH on ES has been largerly rotational!
Price is oscillating inside a well defined range showing volume nodes concentrating around VPOC and Value Area.
Until we see clear acceptance outside the current value area, the bias stays sideways
@GermanDachs The volume profile and larger trades are clustering at the range extreme.
Price is struggling to push further while the cumulative delta stays relatively flat... classic absorption behavior rather than initiative.
Worth watching if the next bar fails to hold the low ..
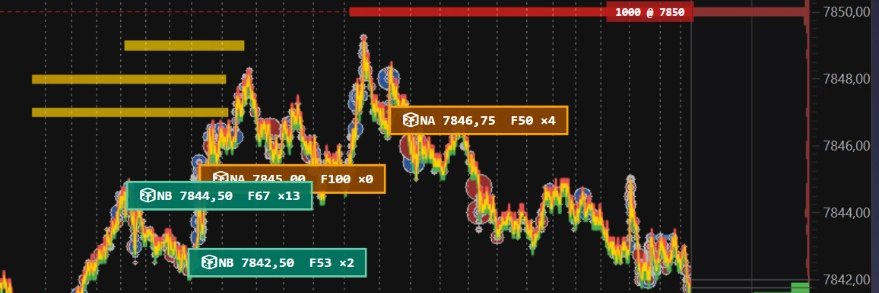
@seethefootprint@Topstep Clear absorption on that 7:48 candle.
The 52x3 iceberg and stacked sell imbalances show sellers stepping in hard right at the high of the move.
Price rejected quickly after, so the level held as supply rather than getting cleared.
@JWatkinsTrades 7755 held the character of a delta-supported level once the sweep was absorbed and price reclaimed.
The earlier large buying print is context, but the actual exchange is whether size printed on the retest and stayed.
Watching how price behaves if it comes back through that area
@toxiewoxiee Got it .
So the main edge for you is the failure to continue lower + the 87% retracement stat into NY open, and 79 is just confluence.
Makes sense.
Do you require the DVG to hold a certain amount of time, or is the failure to push lower enough on its own?
@toxiewoxiee Not assuming how you read it — just clarifying the difference between a volume spike and a level that actually holds.
Absorption needs the bid to stay and get defended on the retest.
Otherwise it’s just a print that filled.
Curious how you define it in practice.
@JWatkinsTrades 7755 only held if the sweep was absorbed, not just tagged.
A large delta from earlier in the week is context.
The trade is whether size actually printed on the way back through the level.
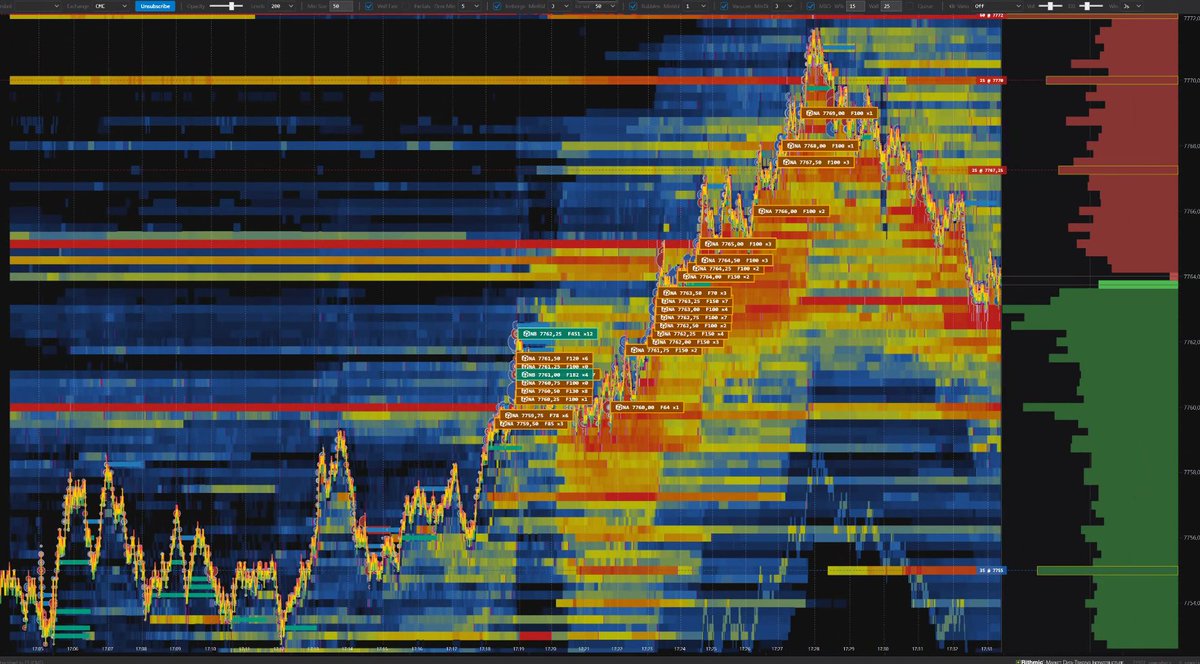
@AdamMancini4 Looking at the footprint around 7767-7770, there were large selling prints and absorption lower down.
How are you reading the order flow in that area?
@OrderflowES Interesting. Looking at the footprint in that zone, large selling prints around 7767-7770 + absorption lower down.
What do you see on the order flow there?
ES order flow: what are you seeing in this zone?
Large selling prints around 7767-7770 and absorption lower down.
How do you read it?
#OrderFlow#ES#Trading
SP500: a che punto siamo davvero?
Analisi su volumi e order flow per capire dove siamo e cosa potrebbe succedere adesso.
Video completo 👇
https://t.co/icfTfSac9S
#SP500#OrderFlow#Trading
@ProfitNotionDly An iceberg only matters if the refill actually held the price.
A print that gets run through is just size that lost.
On NQ the fight is whether that level absorbed or got cleared.
@OmarAgag6 Structure shows the path.
It doesn’t show whether the low was defended with size or just tagged.
On NQ today that difference is the trade, not the line you drew.
@VeganP16776 Slow ES days are where size shows up in one or two prices and nowhere else.
A +725 with almost no rotation usually means you waited for the print instead of forcing the range.
That’s the read.