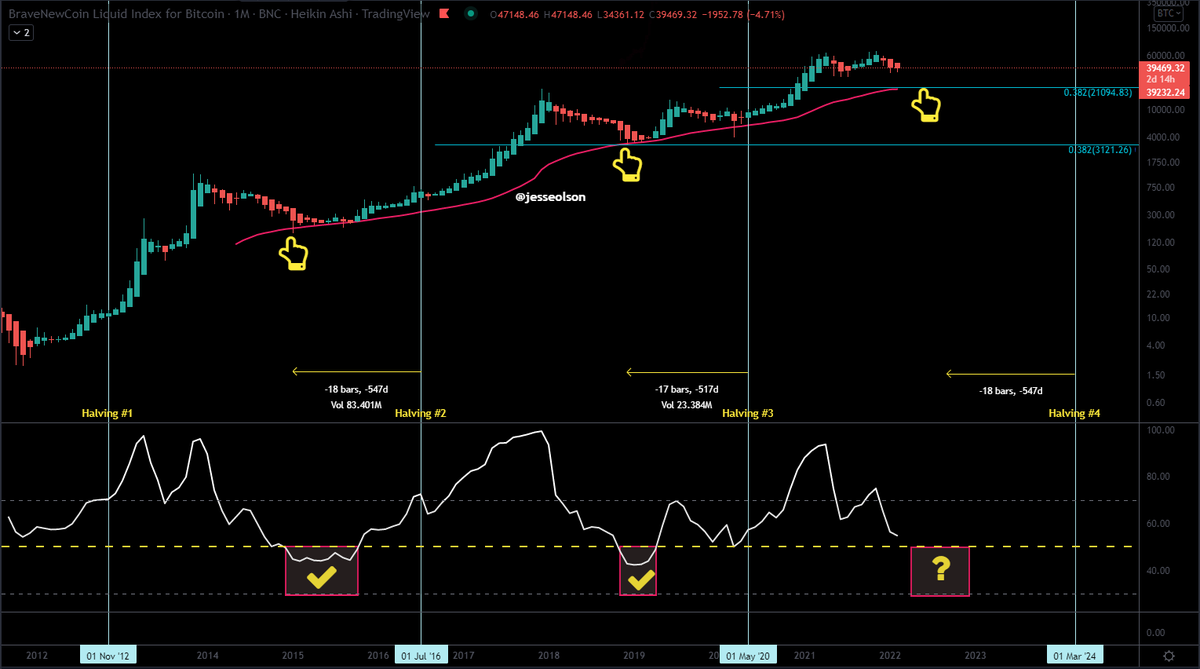
Historically on #bitcoin, this chart suggests it was a good time to buy when either:
- Price was testing the 200 W MA (pink line)
- RSI Monthly was below 50
Currently the 200 MA is at $20,000 on this chart & RSI is at 54.76. Next halving is projected about 24 months from now.
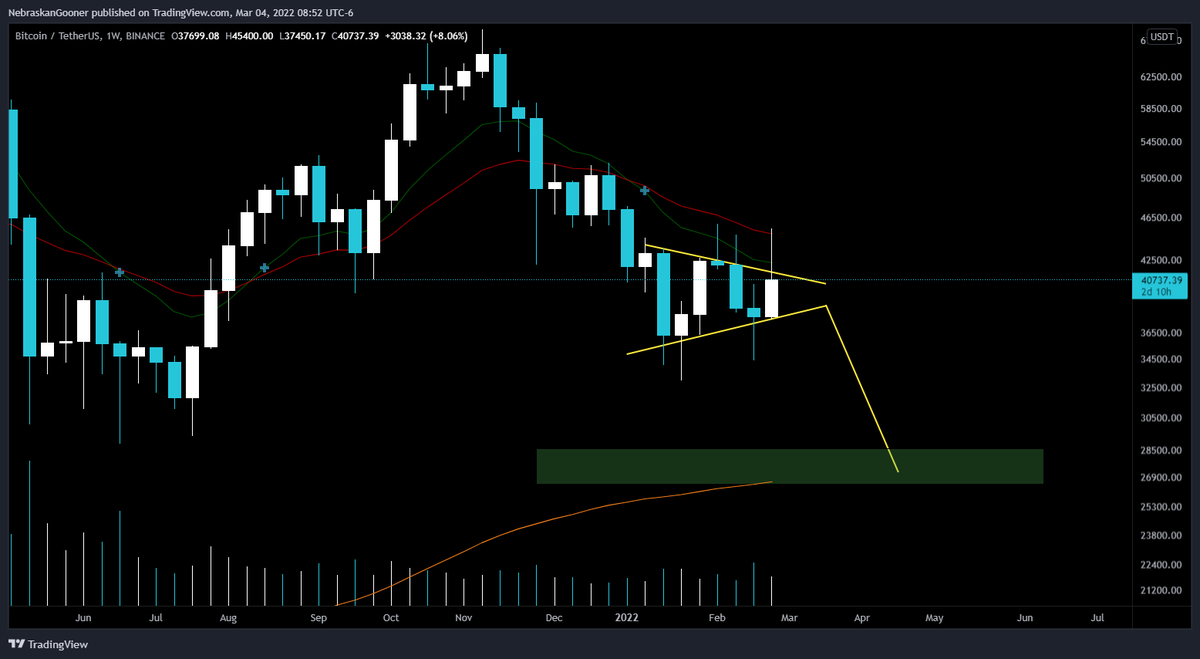
$BTC / $USD - Update
The weekly 200 EMA has become support a few times and more times on other exchanges with more data on #Bitcoin
This also lines up with my $22,000 - $24,000 bottom prediction on BTC. No one can call a bottom, but I have bid down there incase