Industries drawing institutional interest
Retailing, Pharmaceuticals & Biotechnology, and Metals & Minerals Trading were the top industries in which both FPIs and mutual funds increased their holdings in the September 2026 quarter.
Extreme Valuations: Market Psychology, Fear and Greed
Nifty FMCG’s P/E is at the 2nd percentile of its 5-year history and the 1st percentile over 10 years.
Extreme valuations create both risk and opportunity.
The challenge is to determine whether the market is overreacting.
The Nifty has been volatile over the past several days.
Yet options are still pricing in less volatility than the Nifty has typically experienced over the past 10 years.
India VIX is at 15.3, below its 10-year average of 16.6.
US suspends INFY, TCS, Wipro, HCL & a few more from PERM, the U.S. process for employer-sponsored green cards.
H-1B rules have already tightened sharply.
For Indian IT, the cumulative effect could mean more local hiring, higher U.S. delivery costs and potentially lower margins.
Quality isn't enough.
Over 5 years:
Nifty 50: +4.9% CAGR → ~4.3% after LTCG tax
6% FD: ~6.1% pre-tax → ~4.3% after tax at a 30% slab.
After tax, the Nifty barely matches the FD.
To earn a meaningful premium over a fixed deposit, investing takes skill — not just quality.
When private banks get this cheap, history has been kind. But this time, the US10Y looms large.
Nifty Pvt Bank is at 1.9x book, lowest end of the 10Y range.
Historically, when Nifty Pvt Bank traded this cheaply, the next year was almost always positive.
Worth tracking.
The valuation compression is hard to miss.
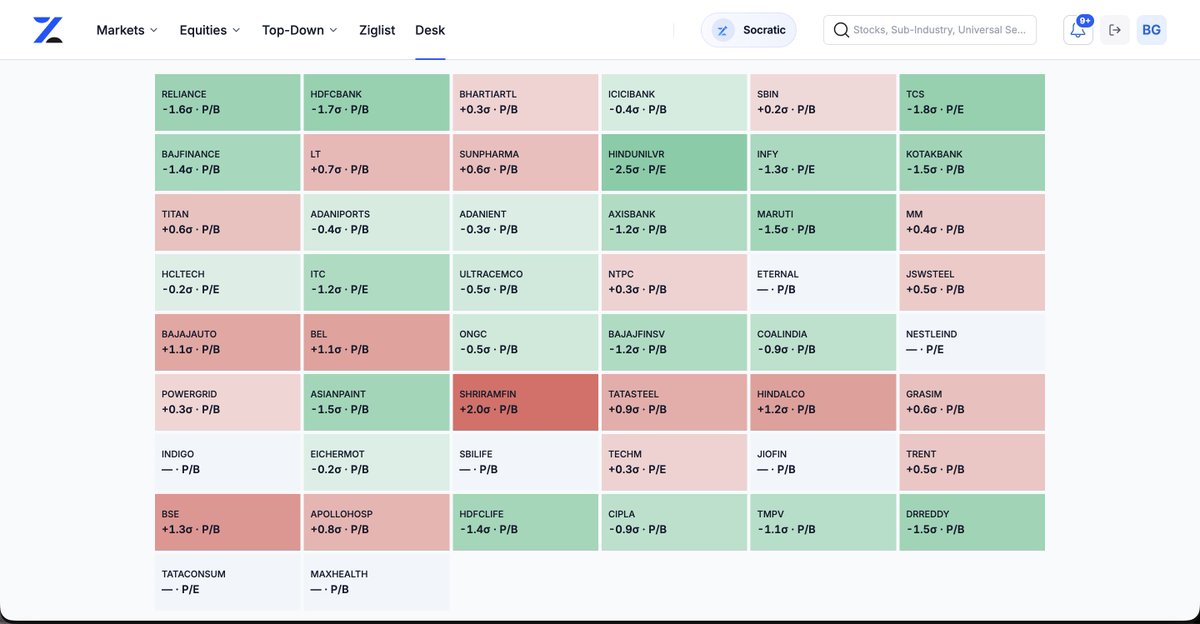
A lot of large cap stocks are trading well below their usual valuations.
Reliance: -1.6σ
HDFC Bank: -1.7σ
TCS: -1.8σ
Here, σ shows how far valuation is from its historical average (10Y): negative = cheaper, positive = more expensive.
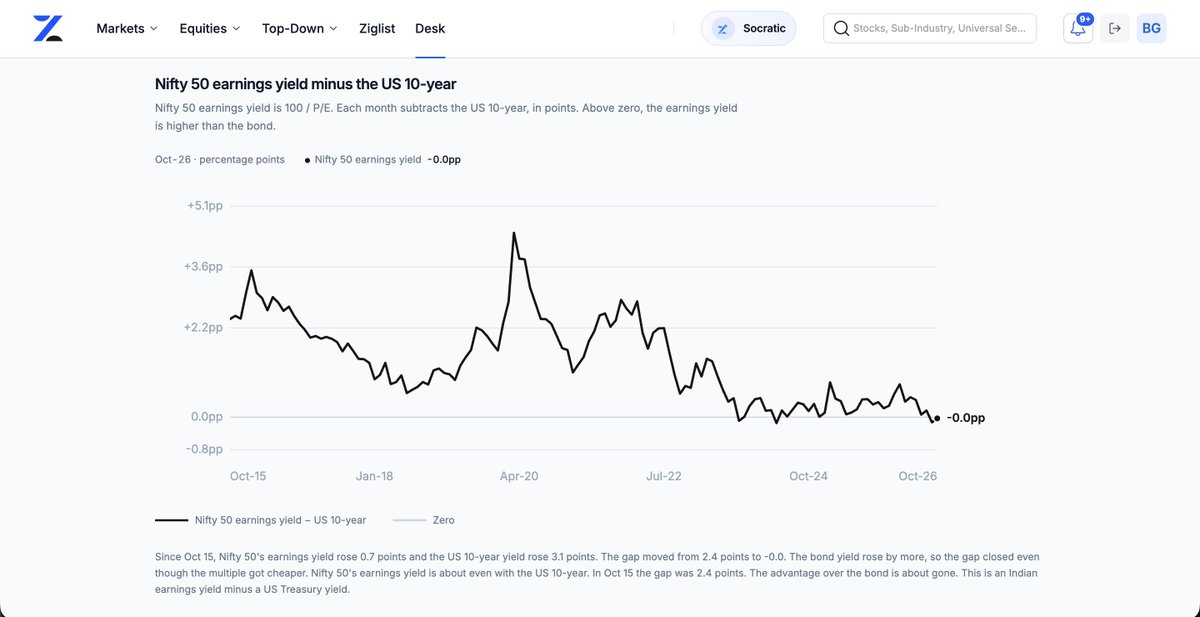
Blame the US 10Y.
Nifty50 is near a 10-year valuation low. You'd think that makes it cheap.
But the US 10Y is above 5.2%, while Nifty's earnings yield is roughly 5.18%.
Nifty50 got cheaper but alternative got much more attractive.
But the high-yield observations are few and include extraordinary periods like the housing #bubble and COVID.
Returns are noisy, and the history offers no simple forecasting rule.
What has happened to Sensex returns when the US 10-year yield breached 5% or entered its historical top 10%?
We compared US 10Y yields with the Sensex’s next 12-month returns since the mid-2000s.
US 10Y yields:
10th percentile: 1.6%
90th percentile: 4.5%
At yields in the bottom 10%, the #Sensex almost always delivered positive returns.
At or above the 90th percentile, it delivered negative returns in only four instances.
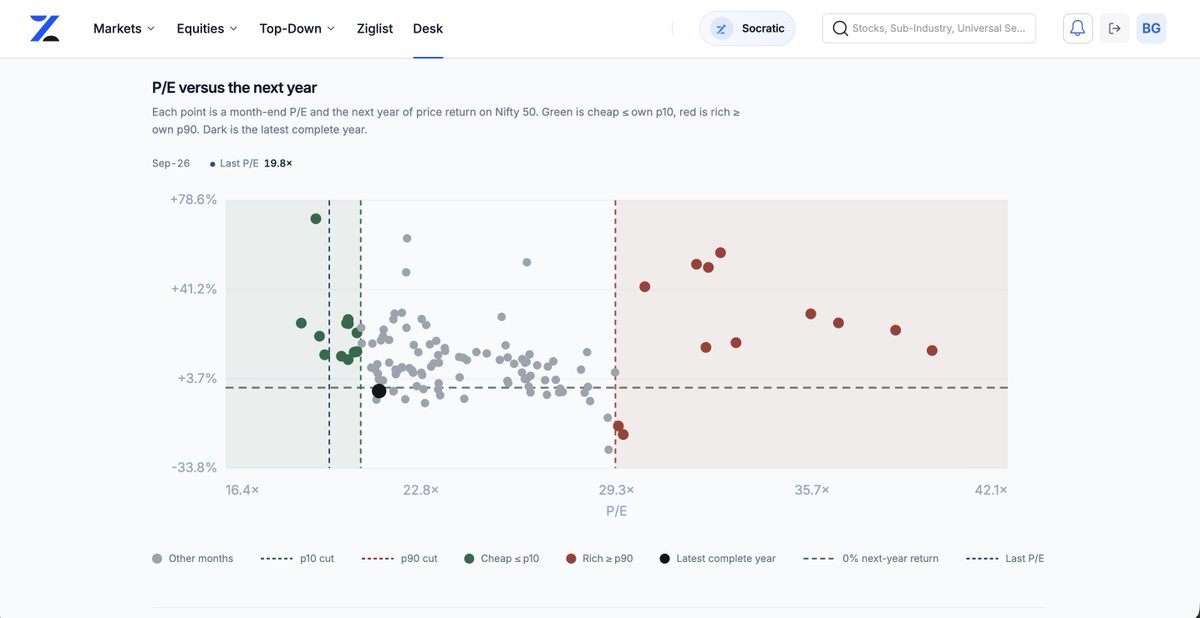
If the #Nifty were to deliver a negative 1Y return from 19.8x, it would represent the lowest starting valuation associated with a negative return in the past decade — a historical outlier.
US10Y above 5% adds a critical macro backdrop.
A historically unusual setup
Over the past 10 years, the lowest starting P/E from which the Nifty50 went on to deliver a negative one-year return was 21.5x.