Large Bitcoin holders reportedly accumulated more than 85,000 BTC.
A report citing Santiment's on-chain analysis said wallets holding between 10 and 10,000 BTC added more than 85,000 BTC over roughly three weeks.
The same report noted that accumulation had not prevented BTC from falling from its early-October highs.
This may indicate buying by large holders, but wallet-size data does not establish who owns the coins or whether the trend will continue.
🚨BREAKING : U.S. spot Bitcoin ETFs recorded $82.4 million in net outflows.
According to data attributed to Farside Investors, BlackRock's IBIT saw $71.8 million in outflows and Fidelity's FBTC saw $10.6 million.
The week of 12–16 October ended with approximately $228.4 million in net outflows.
Persistent outflows may indicate weaker demand through these products, but a single flow report cannot predict BTC's next move.
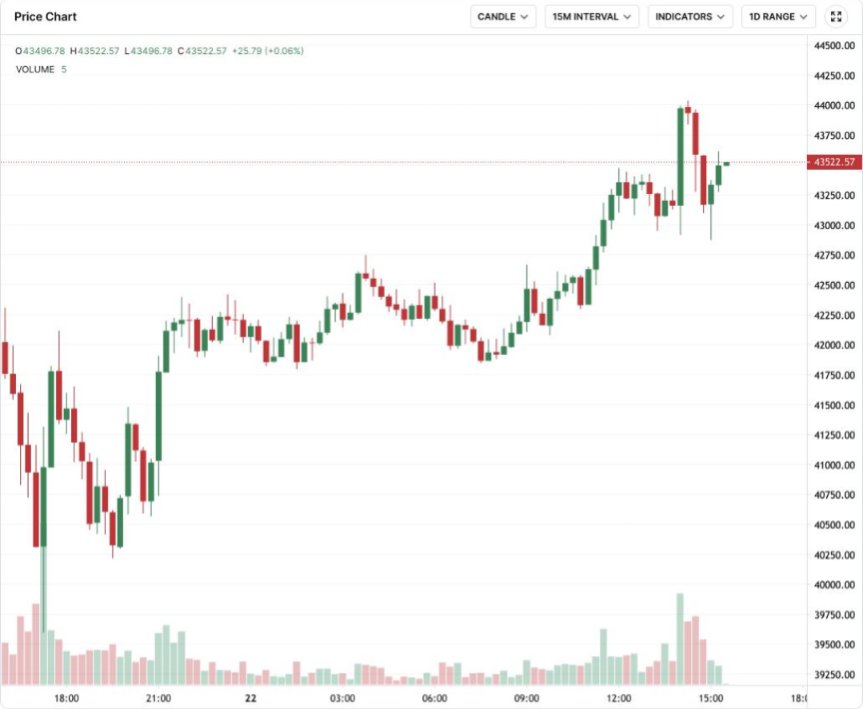
$BTC remains under pressure after a four-week low.
Reported 16–17 October 2026
Bitcoin recently fell to around $79,770 before stabilizing near $82,000.
Market coverage linked the decline to inflation concerns and interest-rate expectations.
A rebound does not confirm a trend reversal. Watch whether price establishes a higher low and reclaims resistance, or loses the recent low again.
4 PRICE ACTION PATTERNS, CLEAN & PROFESSIONAL BREAKDOWN.
These four patterns are some of the most reliable price‑action setups traders use to catch continuation or reversal moves.
Each one shows how liquidity, traps, and break blocks shape market direction.
✅ Bull Trap → Bearish Continuation — A false breakout above resistance grabs liquidity before the real drop
✅ Bear Trap → Bullish Continuation — Price sweeps lows, taps demand, and launches upward
✅ Bearish Break Block Reversal — Break block forms the shift zone for a clean bearish reversal
✅ Bullish Break Block Reversal — Structure breaks, price reintegrates, and buyers take control.
TIME + LIQUIDITY + CONFIRMATION: THE EDGE IS IN THE PROCESS.
A good trade isn't about entering fast. It's about knowing what to look for, where to look, and when to act.
Here's the process:
✓ CONTEXT — Read higher-timeframe market structure.
✓ LIQUIDITY — Identify key highs, lows, and potential liquidity targets.
✓ TIMING — Watch how price behaves during active trading sessions.
✓ CONFIRMATION — Wait for a clear structure shift before considering an entry.
✓ EXECUTION — Define your stop-loss, position size, and risk before entering.
Remember: timing alone isn't a signal, and liquidity isn't confirmation.
Let the market show its hand before you commit capital.
Trade with structure. Execute with discipline. Protect your capital.
Learn the process, not just the entry.
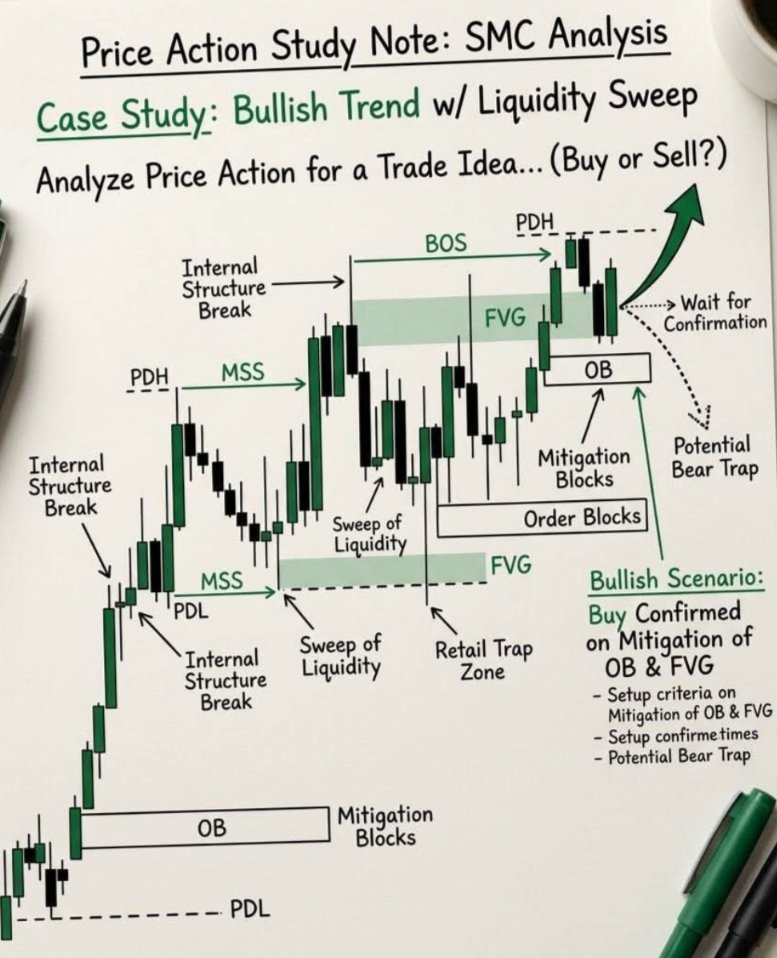
BULLISH TREND CASE STUDY, CLEAN PROFESSIONAL SMC BREAKDOWN.
A perfect example of how liquidity, structure shifts, and mitigation come together to form a high‑probability bullish setup.
Price sweeps liquidity, confirms direction with MSS + BOS, respects OB + FVG, and then drives upward with strength.
✅ Liquidity Sweep — Market grabs liquidity below key levels before reversing.
✅ Internal Breaks — Early signs of trend development.
✅ MSS + BOS — Clear confirmation of bullish momentum.
✅ Order Block Mitigation — Price returns to institutional zones before moving.
✅ FVG Reaction — Imbalance shows displacement and continuation strength.
TO LEARN MORE LINK IN MY BIO.
STOP TRADING EVERY SESSION.
Not every trading session offers a quality setup.
Asia may consolidate.
London may expand.
New York may continue or reverse the move.
These are possibilities, not fixed rules.
Instead of forcing trades, ask yourself:
✓ Where is liquidity?
✓ What is the higher-timeframe bias?
✓ Has structure shifted?
✓ Is the risk-to-reward worth it?
One clean setup beats five emotional entries.
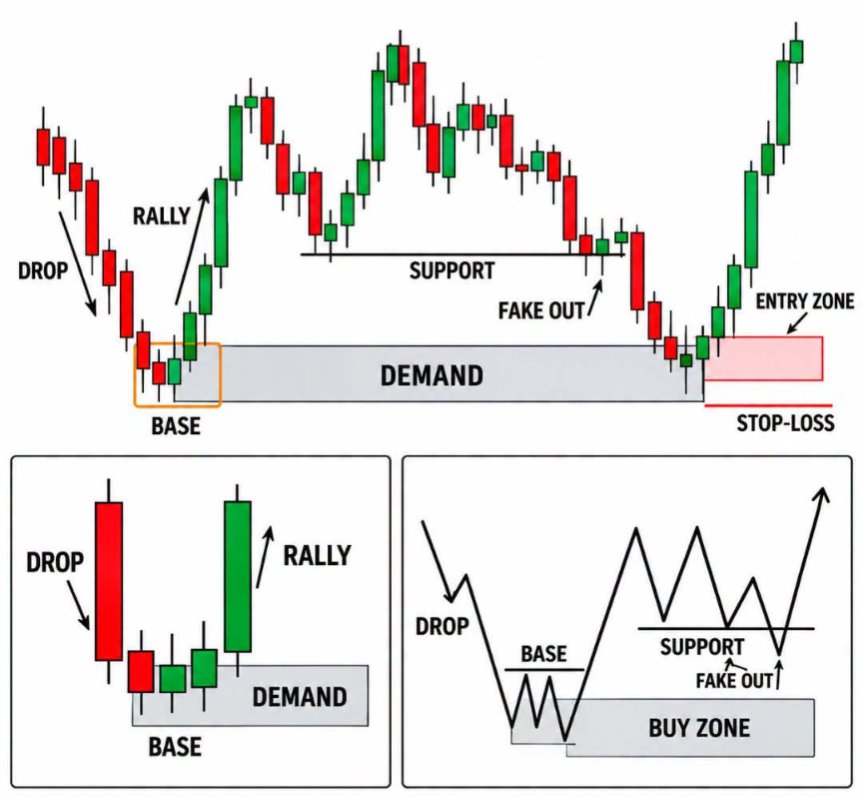
DEMAND ZONE SETUP, CLEAN PROFESSIONAL BREAKDOWN.
A classic Drop–Base–Rally structure gives one of the cleanest bullish setups.
Price forms a base, builds demand, fakes out below support, and then launches upward, offering a precise, low‑risk entry zone.
• Demand Zone — Where buyers consistently step in.
• Drop–Base–Rally — Textbook bullish formation.
• Support Fake‑Out — Liquidity grab before the real move.
• Entry Zone — Clean area for confirmation entries.
• Stop‑Loss Logic — Protected below demand for safety
Simple, clean, and professional, exactly how real traders read demand‑driven reversal.
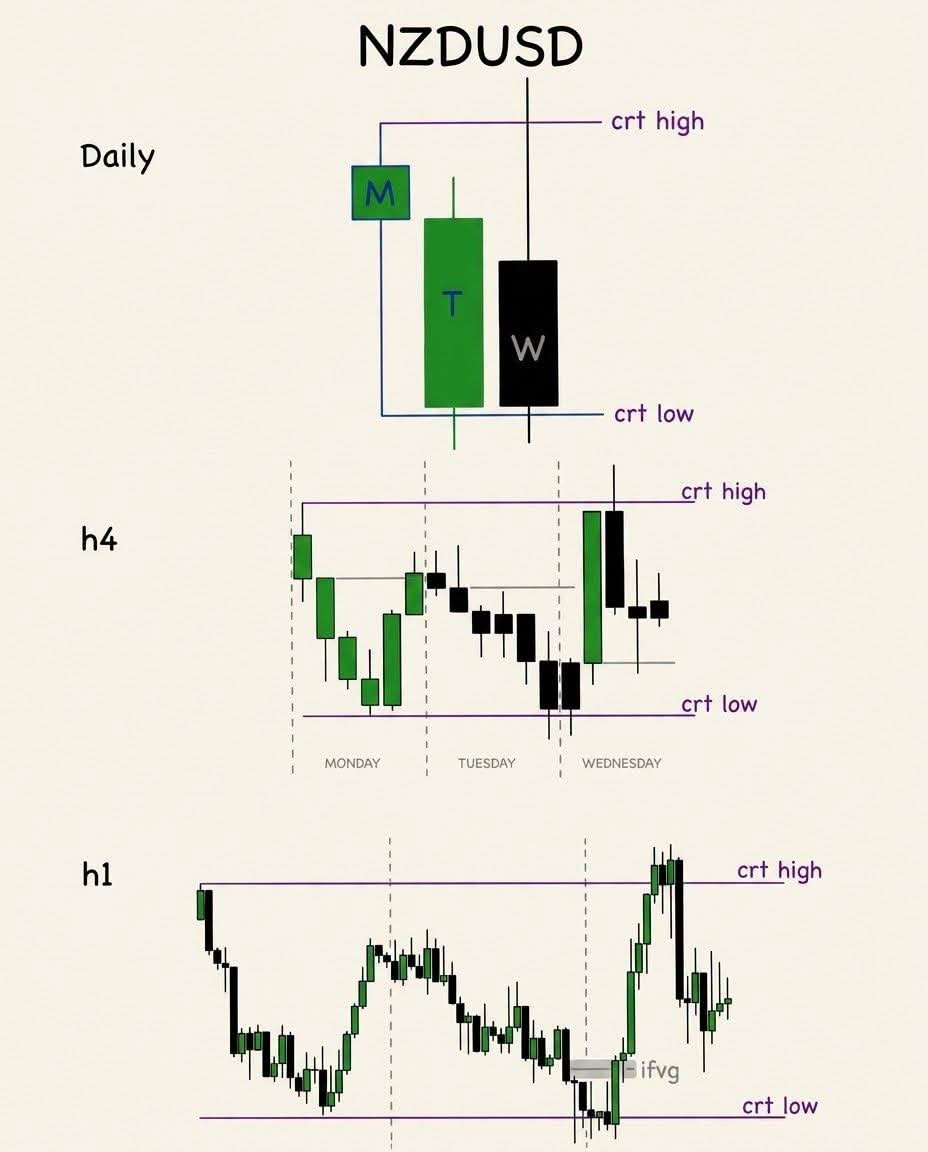
MONDAY SETS THE STAGE.
Monday's price action can establish important weekly levels.
But the first move isn't always the real move.
Watch for:
✓ Weekly high and low formation.
✓ Liquidity resting above and below the range.
✓ Failed breakouts.
✓ Confirmation of a market structure shift.
Your job isn't to predict the week.
Your job is to wait for the market to reveal its direction.
HOW TO READ CANDLESTICKS, CLEAN & PROFESSIONAL BREAKDOWN.
Understanding candlesticks is the foundation of price action.
Every candle tells a story, momentum, rejection, structure shifts, and potential reversals.
When you combine basic candle components with market structure signals, you get a powerful edge.
• Bullish vs Bearish Candles — The real body + shadows reveal who’s in control.
• Break of Structure (BOS) — Market confirms direction with a clean break.
• Market Structure Shift (MSS) — Early sign of momentum changing.
• CHoCH — Clear character change before a reversal.
• FVG — Imbalance showing displacement.
• Order Block (OB) — Institutional footprints marking key zones
Clean, simple, and professional, exactly how real traders read candlesticks with confidence.
ASIA BUILDS THE RANGE. LONDON TESTS IT.
The Asia session often creates a range.
London may sweep the Asia high or low, triggering stop-losses and trapping breakout traders.
New York can bring continuation or a reversal.
My approach:
• Mark the Asia high and low.
• Wait for a liquidity sweep.
• Look for MSS or CHoCH.
• Enter only after confirmation.
Don't trade the breakout blindly. Read the price action.
TRADING SESSIONS: HOW PRICE MOVES
ASIA SESSION = RANGE BUILDING
Price consolidates.
Highs and lows become defined.
Liquidity builds above and below the range.
LONDON SESSION = LIQUIDITY SWEEP
Price may break key levels.
False breakouts can trap traders.
Stops get triggered before direction develops.
NEW YORK SESSION = EXPANSION
Volatility often increases.
Price may continue the trend or reverse.
Wait for confirmation before entering.
MONDAY = WEEKLY RANGE DEVELOPMENT
The market establishes early-week levels.
Price may consolidate.
Watch for the weekly high and low to form.
TUESDAY = LIQUIDITY RUNS
Price may sweep Monday’s high or low.
Breakouts can fail.
Watch for rejection and a shift in structure.
WEDNESDAY = POTENTIAL TREND EXPANSION
Momentum may increase.
Price can extend an established move.
Follow market structure, not assumptions.
MONTH 1 = RANGE FORMATION
Price may consolidate.
Key monthly highs and lows develop.
MONTH 2 = LIQUIDITY TESTING
Price may sweep previous monthly levels.
Breakouts can fail.
Look for confirmation before taking a position.
MONTH 3 = POTENTIAL EXPANSION
Price may break out of the established range.
Volatility can increase.
Manage risk as price approaches key targets.
REMEMBER:
Time provides context, not certainty.
• Mark liquidity.
• Read market structure.
• Wait for confirmation.
• Protect your capital.
TRADE THE SETUP. NOT THE ASSUMPTION.
7 TRADING HABITS THAT CAN CHANGE YOUR GAME.
1. Track your trading hours and identify when emotions take over.
2. Review your mistakes before blaming the market.
3. Follow your rules consistently before judging your strategy.
4. Study your winning trades to find repeatable patterns.
5. Choose a trading style that fits your personality.
6. Review your performance weekly, not just your profits.
7. Step away when needed. More screen time doesn’t mean better decisions.
You don’t improve by trading more. You improve by learning from every trade.
Discipline first. Capital protection always.
PULLBACK CONFIRMATION, CLEAN PROFESSIONAL BREAKDOWN.
A strong bullish push followed by a controlled retracement is one of the most reliable continuation setups.
Price rejects sharply, pulls back into a major structure level, aligns with the EMA, and then resumes momentum, giving a precise, high‑probability entry.
• Structure Level — Price respects a key zone before continuing.
• Sharp Rejection — Buyers show strength early.
• Controlled Retracement — Healthy correction, not a reversal.
• EMA Alignment — Trend support confirms continuation.
Clean, simple, and professional, exactly how real traders validate pullback entries.
BREAKER BLOCK + FVG, CLEAN PROFESSIONAL SETUP BREAKDOWN.
This setup combines structure, liquidity, and institutional zones to create a precise, high‑probability entry.
Price grabs sell‑side liquidity, shifts structure, reacts from the breaker block + FVG supply, and continues with momentum, delivering a clean RR move.
✓ Breaker Block — A powerful supply zone formed after structure shifts.
✓ FVG — Imbalance showing displacement and institutional activity.
✓ Liquidity Sweep — Market takes sell‑side liquidity before reversing.
✓ MSS + BOS — Clear confirmation of direction change.
✓ RR Projection — Structured entry with strong reward potential.
A clean, real‑trader breakdown, smart money concepts applied with precision and clarity.
SMART MONEY STRATEGY, CLEAN MULTI‑TIMEFRAME BREAKDOWN.
Real traders don’t guess, they align timeframes.
This setup shows how direction, liquidity, and sniper entries come together for a high‑probability move.
✅ 4H Bias — Higher timeframe gives the directional story.
✅ 1H Liquidity Sweep — Market grabs liquidity before shifting.
✅ 5M Sniper Entry — Precise confirmation for low‑risk entries.
Clean, structured, and professional, exactly how smart money traders build confidence in their setups.