Most support and resistance lines are drawn by eye.
MarketLevelMap measures them.
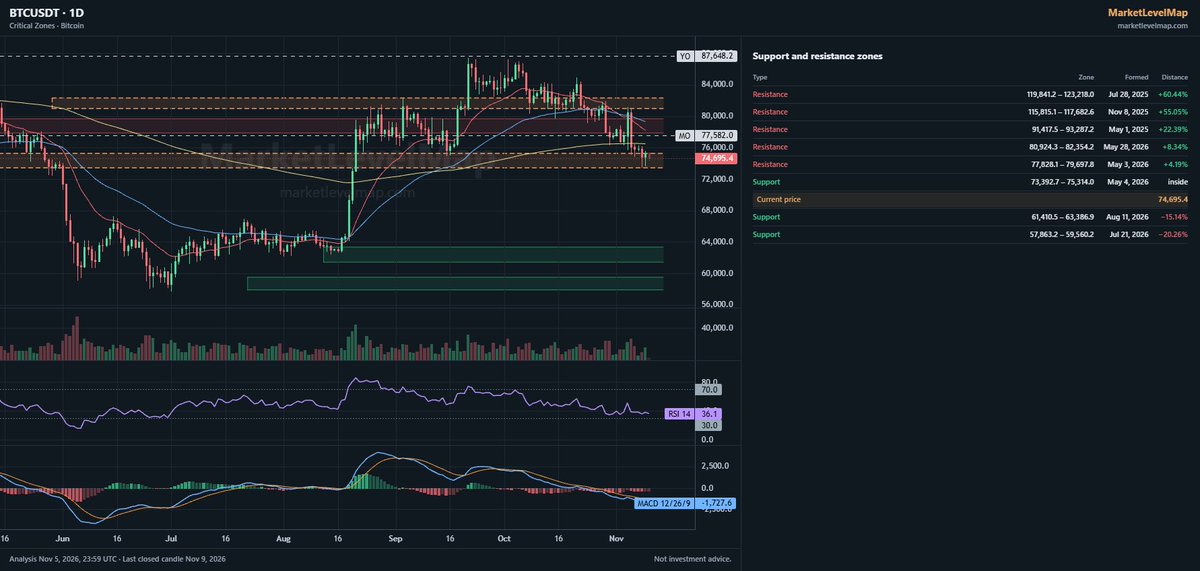
• Critical Zones: where price actually reacted
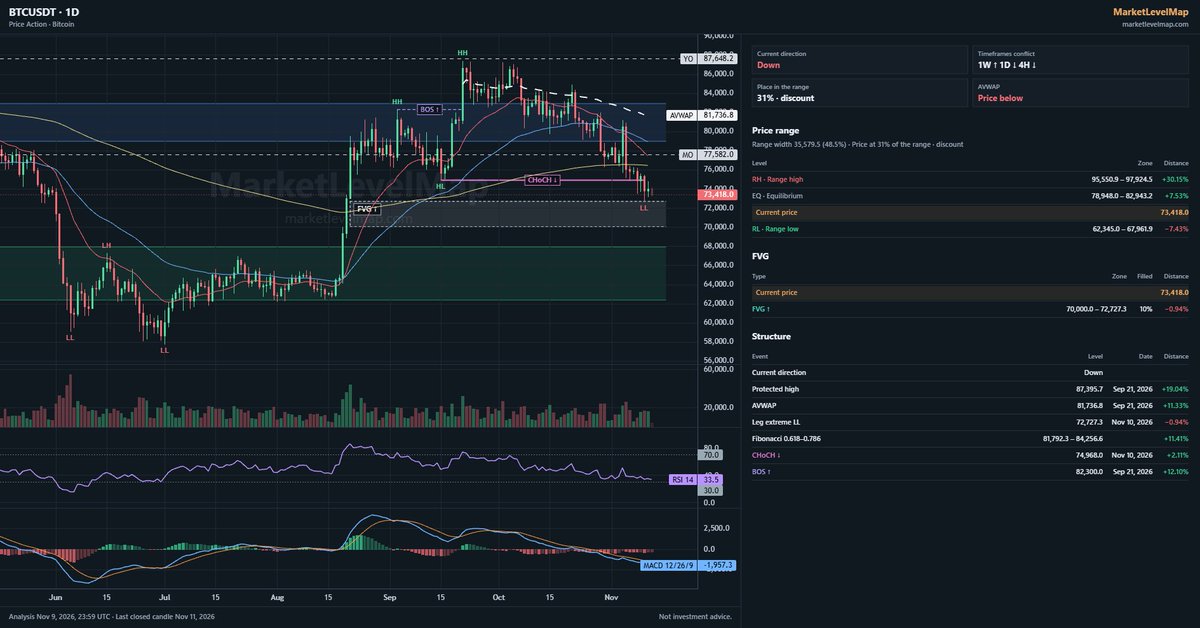
• Price Action: range, BOS/CHoCH, sweeps, FVG
• Key levels: daily, weekly, monthly opens
1H to 1W. Every analysis dated.
https://t.co/SPfCVk1dhx
BTCUSDT · 1D · Critical Zones
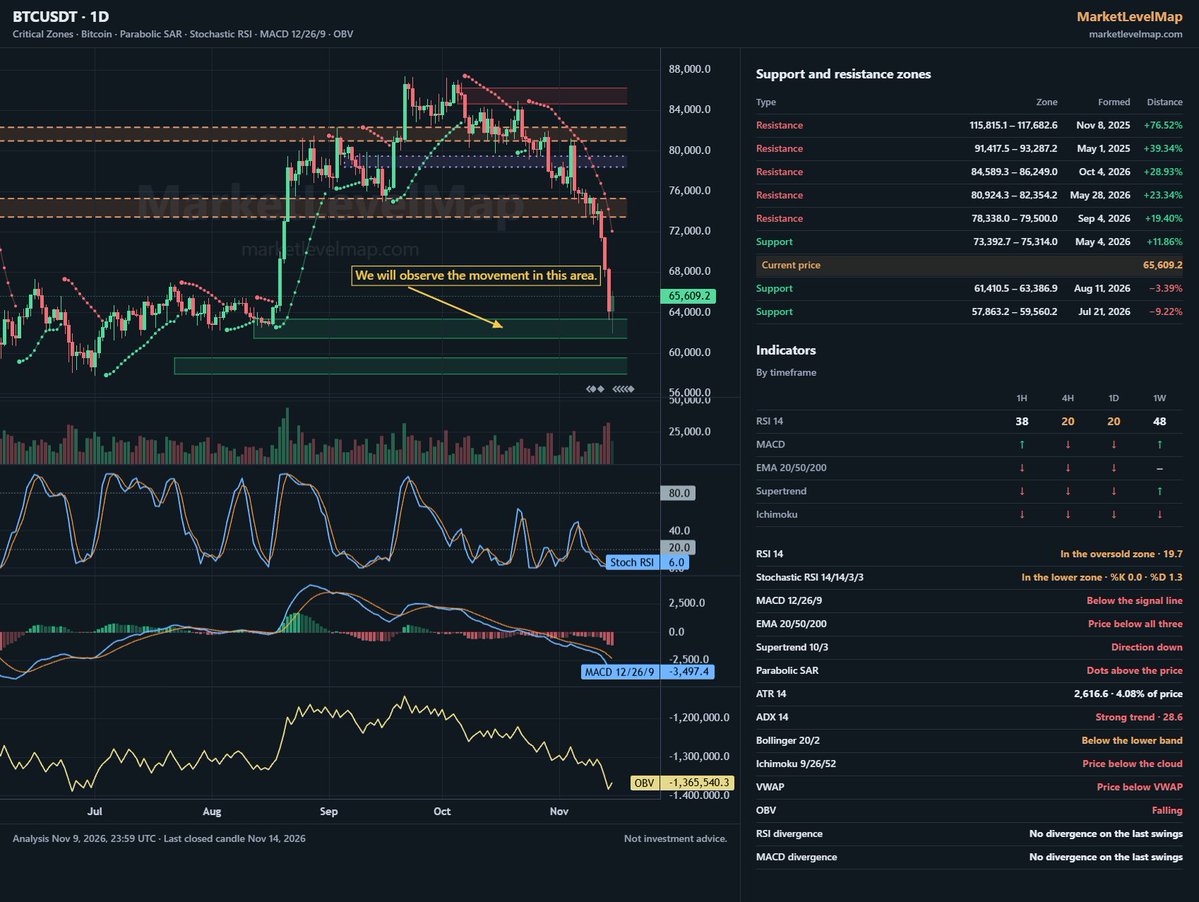
The negative scenario played out, but the price failed to hold in the 72,500 range. Moving forward, we will watch to see if it finds a rebound in the 61,000–63,000 range. The market continues to trend in a negative direction.
BTCUSDT · 1D · Critical Zones
The negative scenario played out, but the price failed to hold in the 72,500 range. Moving forward, we will watch to see if it finds a rebound in the 61,000–63,000 range. The market continues to trend in a negative direction.
Higher timeframe issues will persist until the 75,000–76,100 area is reclaimed and held. If 72,500 is lost after any recovery from this zone, the next areas to watch would be 69,000 and then the 61,000–63,000 zone.
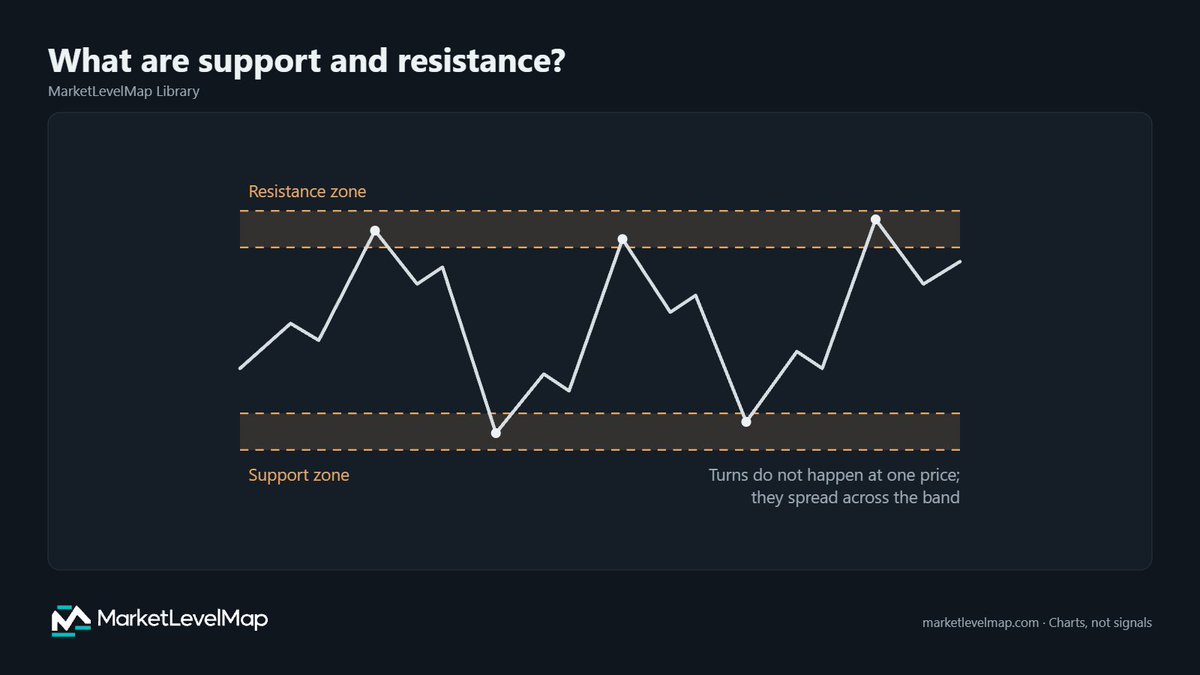
What are support and resistance?
Support is a price area where falling price has stopped and turned up before; resistance is an area where rising price has stopped and turned down before. These areas come from past reactions.
Key points:
• Support and resistance are areas where price has reacted in the past
• Reactions happen over a width, not at one price, so a zone is read as a band
• A zone is cleared by a close beyond its far edge
• A zone's past strength does not guarantee a future reaction
We've been seeing a series of declines since the institutional level of YO (around 87,600). Market structure has been bearish since then: Lower Highs and Lower Lows continue, and no Higher High / Higher Low structure that would shift it bullish has formed yet.
Higher timeframe issues will persist until the 75,000–76,100 area is reclaimed and held. If 72,500 is lost after any recovery from this zone, the next areas to watch would be 69,000 and then the 61,000–63,000 zone.