Using LLMs ~3h a day for strategic macro research and Machine Learning @P123Finance (pure reasoning, zero basic coding).
The real-world stack ranking right now:
❌ ChatGPT: Generic, over-aligned textbook replies. Throttles like hell
⚠️ DeepSeek: Better depth, but the infrastructure is choking on peak-hour traffic lately, Throttles as well!
😐 Claude: Mezzo, mezzo. Highly technocratic and rigid. Accurate, but lacks creative edge for non-linear problem solving.
👑 Gemini (Flash): The clear winner. Elite macro knowledge, fluid reasoning on complex ML architectures, and handles massive context without breaking a sweat.
🧠🤖 #AI #Quant #Macro #LLM #AIFactor
In terms of index action, a pullback like this is pretty normal given the prior rip after the shakeout. However, if you had fomo and chased high-flyers late, you are certainly feeling it on a day like today. If you are in this camp, lesson learned. Put it in the mental Rolodex, onto the next. The silver lining is you get to see which things hold up best. In terms of the Qs, nothing is technically broken as of right now. 34% move off the lows followed by 6% pullback to retest this MEGA channel top. Pretty big spot. If buyers step in and price starts to stabilize around here in the coming weeks, you know there is a shot of even higher prices. If not, then even more patience is required for most things to come around again.
You don’t need to try and make money every day. Stalk, stalk, stalk…buy ‘em tight and reduce ‘em loose.
Go outside and enjoy the company of others. There is more to life than the market, it’s a big world out there. 🤗 HAGW, Cheers 🍻
The systematic index futures Day trading programs dont wait until 4 PM to cover their shorts. They start covering at 3:30. (volatility breakout, etc). However the models still suggest odds that price will trade below todays low in the next 24 hour session.
The 8week Exponential Moving Average (EMA) which equates to roughly a 39-day or 40-day EMA on a daily chart acts as the ultimate institutional sweet spot between the short-term 21-day EMA and th e longer-term 50 day Simple Moving Average (SMA).
Here is the structural and mathematical breakdown of why high-velocity momentum traders and institutional algorithms treat this specific level as a primary line in the sand:
1. The Moving Average Spectrum
To understand why the 8-week EMA is so effective, look at how it bridges the gap during a true market leader's advance:
The 21-day EMA: This is the short-term swing baseline. In a roaring, high-velocity "lockout rally" or High Tight Flag (HTF) setup, the price will ride right above the 21-day. However, because it is a fast indicator, normal multi-week market digestions will frequently pierce or break it, shaking out weaker retail hands.
The 50-day SMA (or 10-week SMA): This is the traditional, widely watched institutional baseline. The problem for hyper-growth momentum stocks is that the 50-day is often too deep. By the time an explosive market leader retraces all the way to its sloped 50-day, the chart has often sustained technical damage, structural retention is lost, and the premium has completely deflated.
The 8-week EMA (The Sweet Spot): This sits precisely in the pocket between them. It allows an elite stock to experience a natural 2-to-4-week consolidation without deflating its premium or breaking its primary high-velocity structural advance.
2. Where Institutional "Stealth" Accumulation Occurs
Because the 8-week EMA is an exponential average, it places greater weight on recent price action. When an elite, high-Relative Strength (RS) leader undergoes a healthy pullback, large institutions looking to build or add to massive core positions cannot wait for a deep test of the 50-day SMA if they wait that long, they miss the stock entirely.
Instead, algorithms and large funds use the 8-week EMA as a stealth accumulation zone.
On a daily chart, you will frequently see a high-velocity stock break below its 21-day EMA, causing retail traders to panic.
The stock will slide into the empty pocket below, only to experience aggressive buying tailwinds and "wick plays" (candlesticks with long lower shadows) right around the 39-day/40-day daily line.
It tags the 8-week structural proxy, supply dries up completely, and the stock reverses back into a continuation pattern.
3. The Mathematical Logic & Risk Management
For a active trader managing expectancy with a strict risk-to-reward target (such as a 1:5 risk-to-reward ratio), entering a position as close to the 8-week EMA as possible offers an incredibly asymmetric setup:
Moving Average Entry Type Risk Profile Structural Integrity 21-day EMA Momentum Chasing / Continuation Higher risk of immediate shakeout during market corrections. Aggressive, easily broken. 8-week EMAStructural Pullback / Cheat Entry Lowest risk. Allows for a tight stop just below the structural low. High retention, clean institutional support. 50-day SMA Deep Value / Mean Reversion Wider necessary stops; momentum characteristics may be broken. Lagging, often represents a broken trend.
By buying the contraction into the 8-week EMA especially when accompanied by a textbook drop in daily volume (supply contraction) you can position your stop-loss just a few percentage points beneath the structural pivot. If the institutional floor holds and the stock launches into its next extension leg, achieving a 1:5 or greater expectancy on the trade becomes highly achievable because your initial risk capture was exceptionally tight.
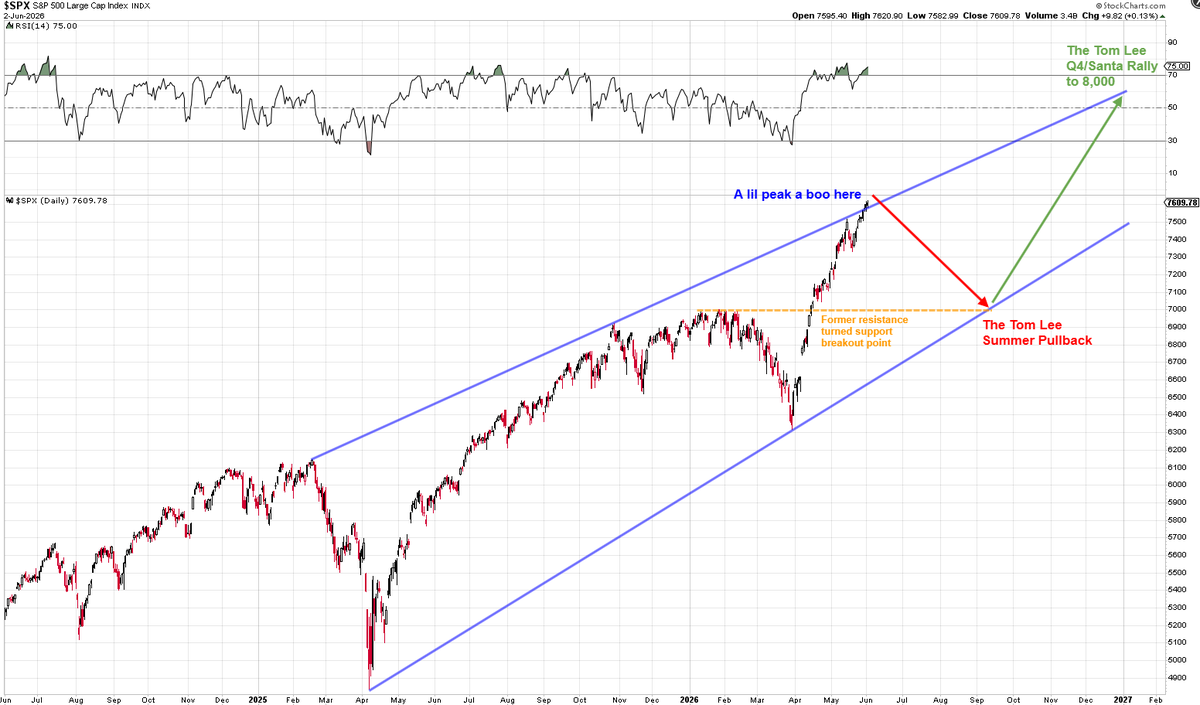
$SPX Potential roadmap for the rest of the year:
7,600-7,700 ish
-->
7,000 ish (buy this dip!)
-->
8,000 ish
Would fit nicely with the squiggly lines that kinda looks pretty and makes sense...
@fundstrat
$SILVER $AG $SLV $GOLD
There is a key support area around $75 that could represent the base for the start of the bullish wave visible on the inverted fractal.
I’ll see you on the blog: https://t.co/8pNBSzmCJ8
Leaders that will continue higher that you should be targeting on any mild weakness into end of May
$SNDK
$MU
$INTC
$AMD
$NBIS
$BE
$GLW
$RKLB
$AAOI (smaller but best still liquid)
$ARM
Many others but these still have juice in the tank, end of summer minimum
Playing:
20 years of micro/small cap alpha — visualised in 3D.
Return vs year vs excess over S&P 500, all in one terrain surface. Every peak is a year. Height = return. Depth = alpha.
2023 & 2013 are the twin summits. 2008 is the only crater.
2026? Flat ridge. Still standing.
📊 Full dashboard → [Dashboard - Portfolio123](https://t.co/Z4U3f81mVS)
#quant #smallcaps #investing #algotrading #portfolio123
@NautilusCap There is still a drop missing to complete the 5th wave downwards...no sign of a reversal and an appointment between October and November 2026
$VIX daily chart has a wedge pattern long with RSI positive divergence, as well as converging Bollinger Bands, could be set for a pop here and logical pullback on the S&P 500








#quant #smallcaps #investing #algotrading #portfolio123](https://pbs.twimg.com/media/HIdNyJfW8AAglet.png)


