Silver dropped almost 50% from June 1968 to November 1971, and then rallied ~420% into February 1974.
Silver then dropped ~43% into 1976 and then rallied ~1150% by January 1980.
Silver dropped 60% from March to October 2008 and then rallied ~490%.
Gold dropped almost 30% in late-1973 and then rallied almost 100%...and then dropped ~25% and then rallied another 45% all by January 1975.
Gold dropped 50% in 1975 and 1976 and then rallied ~770% by Jan 1980.
Gold dropped ~26% in 2006 and then rallied 90%.
Gold dropped ~35% in 2008 and then rallied 180%.
This sell-off since January 2026 is now the third largest silver has ever had within the context of a bull market, and for gold it's the the fourth largest...almost on par with the 1973 correction and nearly on par with the Great Financial Crisis. In terms of time from top to bottom, this is more akin to the 1973 correction (about 20 weeks) or 2006 (about 20 weeks).
All of these drops led to enormous V-bottom rallies, some so rapid that if they repeated today it would mean $8000+ gold by October.
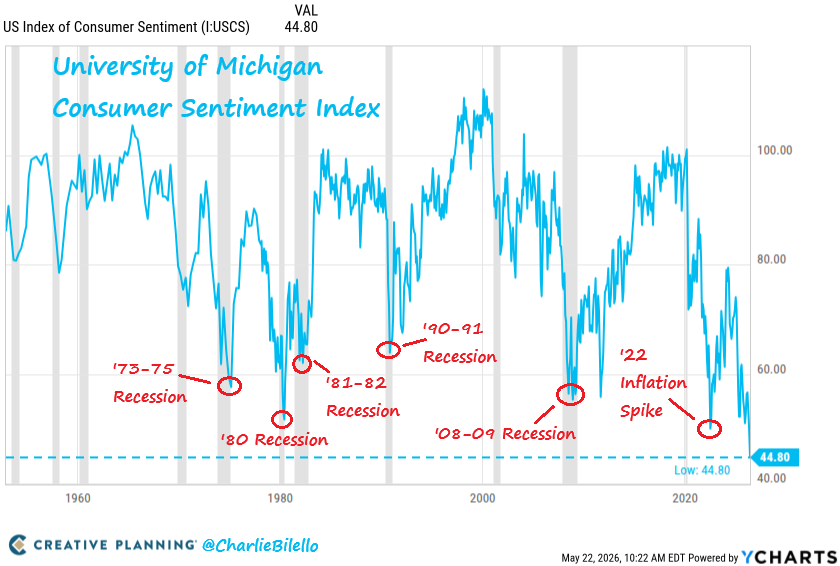
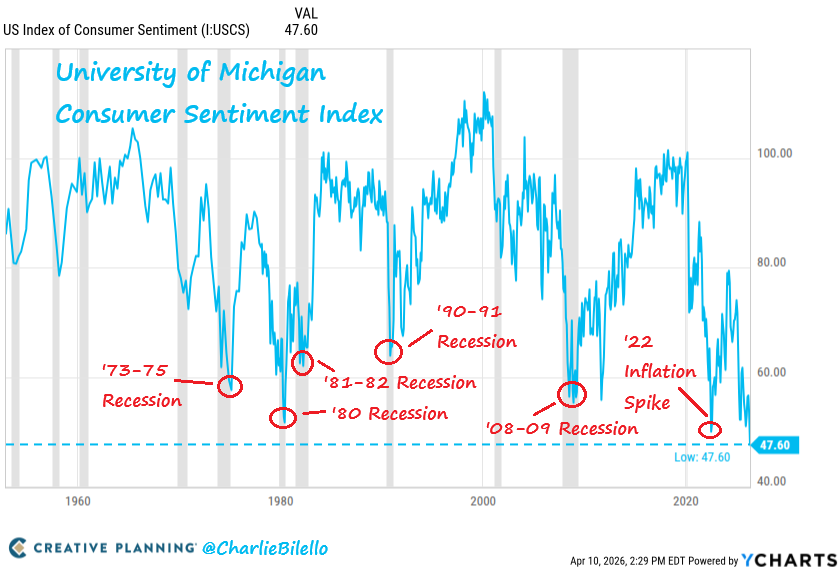
The US consumer sentiment index from the University of Michigan goes back to 1952.
It has never been lower than it is today.
Video: https://t.co/8USvFpWxZN
"Credit expansion is the governments’ foremost tool in their struggle against the market economy. In their hands, it is the magic wand designed to conjure away the scarcity of capital goods, to lower the rate of interest or to abolish it altogether, to finance lavish government spending, to expropriate the capitalists, to contrive everlasting booms, and to make everybody prosperous."
Ludwig von Mises, Human Action
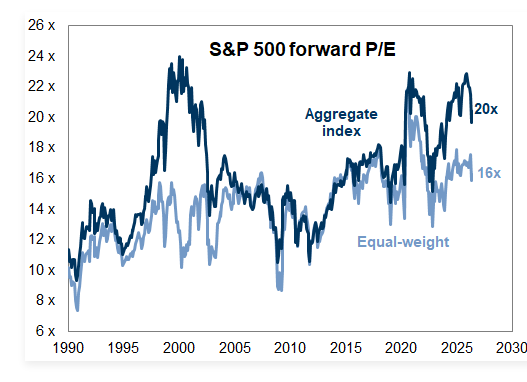
US stock market concentration is easing:
The top 10 stocks now reflect ~37% of the S&P 500 market cap, the lowest since Q2 2025.
This percentage has fallen -5 points for its high, posting the biggest drop since the 2022 bear market.
However, it is still 10 percentage points higher above the 2000 Dot-Com Bubble peak.
To put this into perspective, the top 10 companies made up just ~22% of the S&P 500 at the beginning of 2020.
This comes as 6 of the Magnificent 7 stocks have entered a correction, with META, $META, and Microsoft, $MSFT, effectively trading in a bear market.
The average stock is now outperforming Big Tech.
It appears that commodities are moving in lock step.
Good chart below from Tavi Costa….
"Gold tends to move first.
Copper follows.
Energy is moving now.
Agricultural commodities are likely next.
While the focus today is on oil, rising energy prices rarely stop at the pump.
Prices eventually work their way through the entire commodity complex — with food prices often being one of the final destinations."
The broad commodity index (the CRB) is also breaking out from the base.
The precious and industrial metals portion of the index have been moving higher for some time. Energy has been the holdout.
If this runs higher, inflation is almost certain to follow higher.
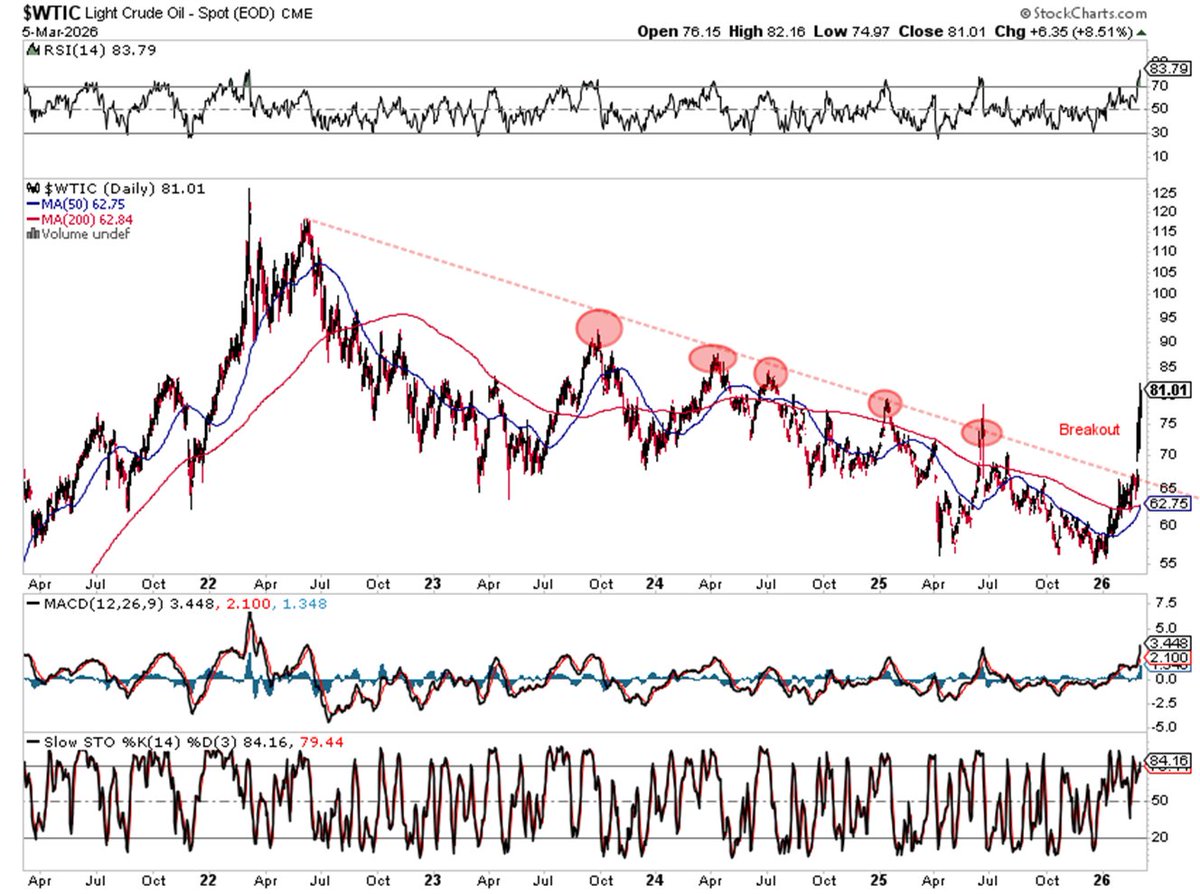
This looks like a significant breakout in oil.
The trend has been down since 2022. It has tried to break that trendline on five different occasions.
It did it this time.
Unfortunately, when a breakout like this occurs – you must give it the benefit of the doubt and expect higher prices.
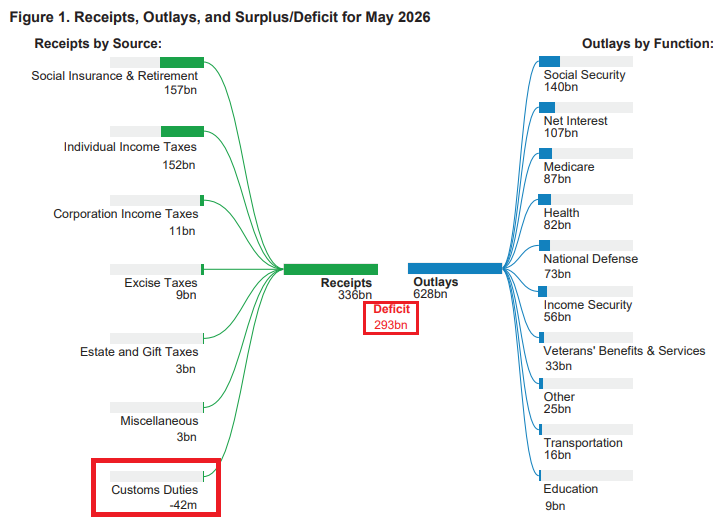
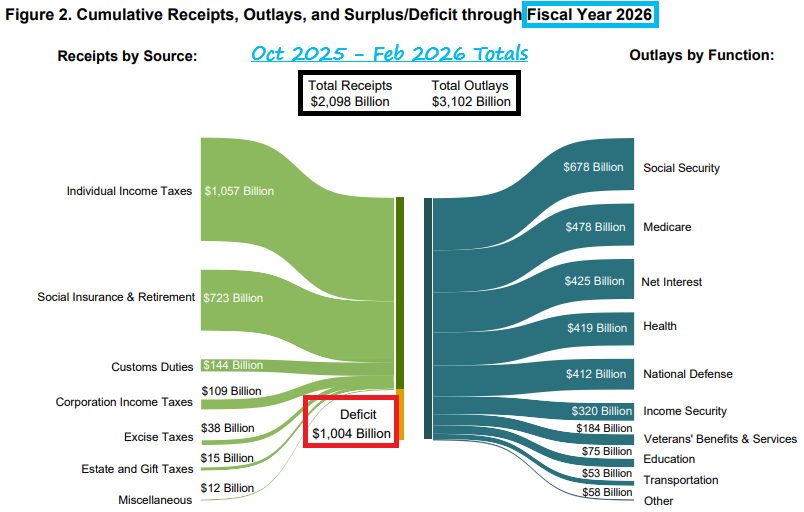
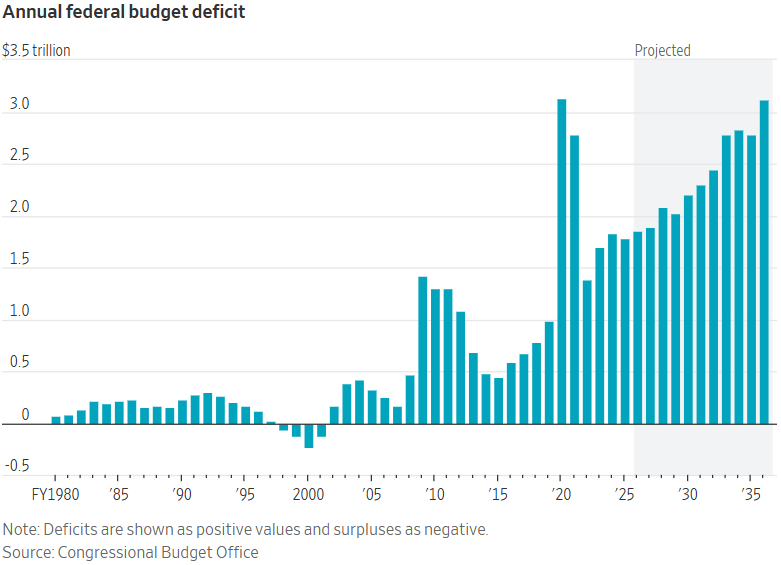
The government says inflation is “coming down.”
But we’re still borrowing $2-3 TRILLION a year in good times.
You don’t print and borrow at this scale and get stable prices.
Structural deficits = structural inflation risk.