Excited to share my portfolio website! I've been brainstorming ways to announce that I'm open for data analyst roles and freelance work, and what better way to do it than showcasing my portfolio ✨
Linking this site, along with my other projects, to this tweet 👇
Understanding Microservice Architecture 😊
Microservices are about building flexible, scalable systems by breaking down applications into small, independent services.
Let’s break it down:
1. Client Request: The journey starts when the client sends a request, like fetching data or placing an order. 💻
2. API Gateway: Routes the request to the correct service, and handles traffic, security, and load balancing. 🚦
3. Identity Provider: Verifies who you are and if you have permission to access the requested service. 🔐
4. Services:
- Catalog API: Manages product data using MongoDB. 📚
- Basket API: Tracks your cart items, powered by Redis for speed. 🛒
- Ordering API: Processes orders using PostgreSQL for secure storage. 📦
5. RabbitMQ: Helps these services communicate asynchronously, ensuring smooth message flow between them. 🐇📨
6. Docker: Packages services into containers, making deployment consistent across environments. 🛠️
7. GitHub: Houses the code for collaboration and version control. 💻
8. Terraform: Automates infrastructure management, making it easy to set up servers, databases, and networks. 🏗️
9. Pipelines: Automates the build, test, and deployment process for faster, reliable updates. ⚙️
Microservices ensure that each service does one thing well, making systems more flexible and scalable. If one service fails, the others keep running, and updates happen smoothly without disruption. 🚀
---
I hope this helps! Thoughts? 😊 #Microservices #TechExplained #DeveloperLife #CloudComputing
Join my Newsletter for more such tips and content: https://t.co/BZNvyzpTgd
Just finished a Streamlit dashboard on Japan's restaurants! 🌸I'm currently transitioning into a new role so I decided to brush up on my Python skills by developing this project. It includes interactive filters, maps, and graphs for a clear look at the dining scene.
Faced with a mountain of data, how do you go about starting your exploratory data analysis? How do you know where to look at first?
Loren Hinkson shares a helpful, 11-step plan for building an effective and resilient process. https://t.co/s8rMcAq92M
Just open source my note taking app build with @streamlit, it can turn your photos and screenshots into text notes in your #obsidian
Try a new way of taking notes next time you go to a conference or talk.
https://t.co/pDfRmw93As
Banning the purchase of sex 🚨DOES NOT🚨increase cases of reported rape.
A re-analysis of Ciacci (2024) shows that the paper's headline result comes from an erroneous use of Stata's regression command.
A thread from @Jopieboy, @OlleFolke, and me 1/11
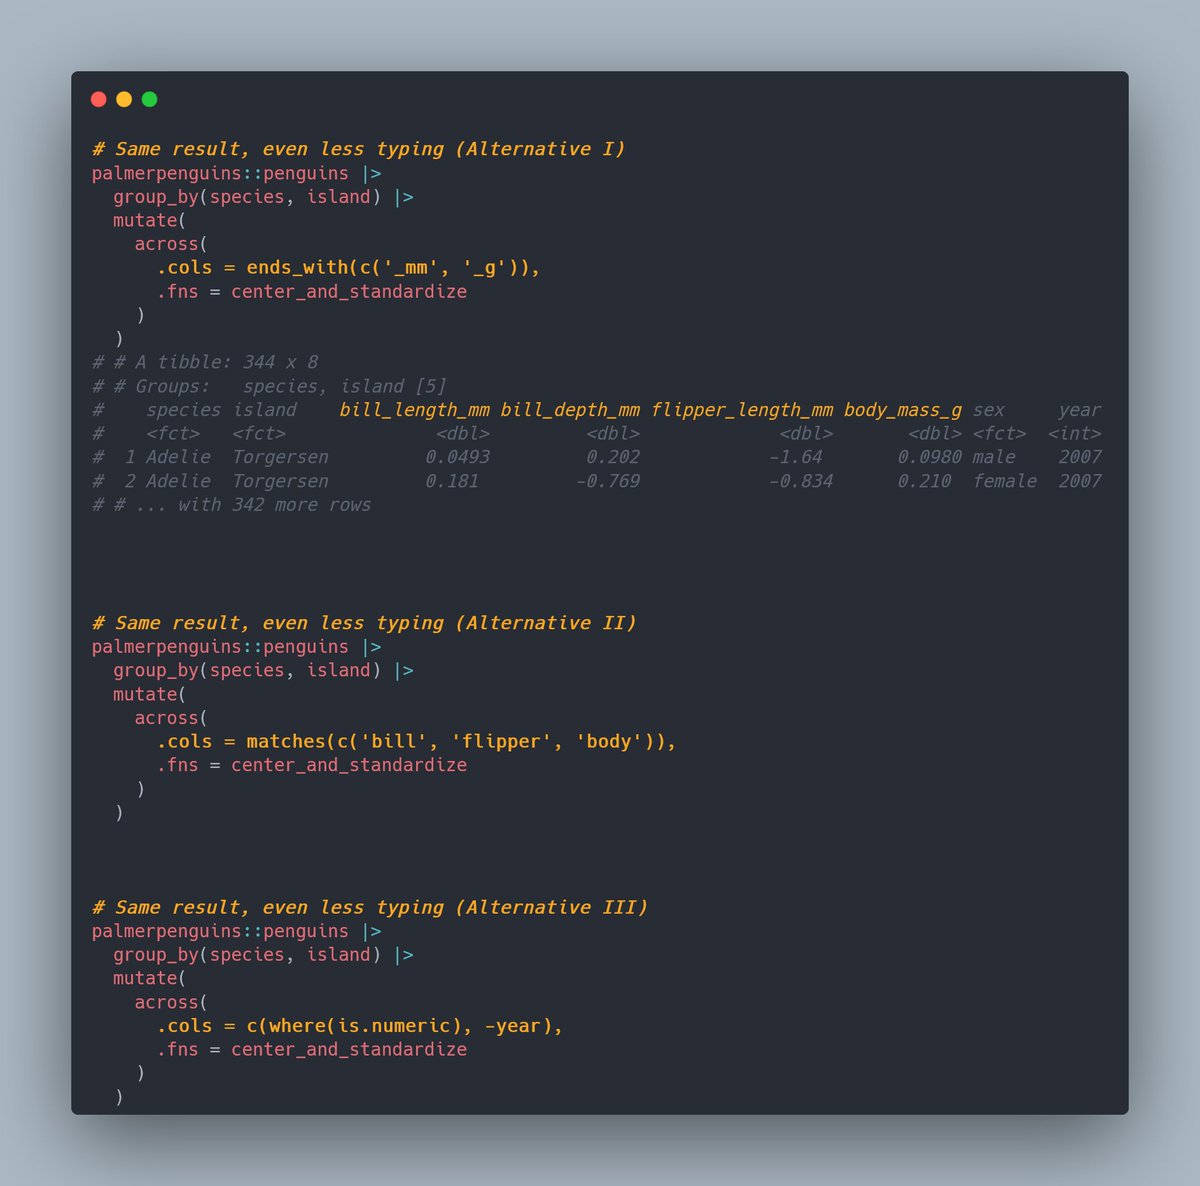
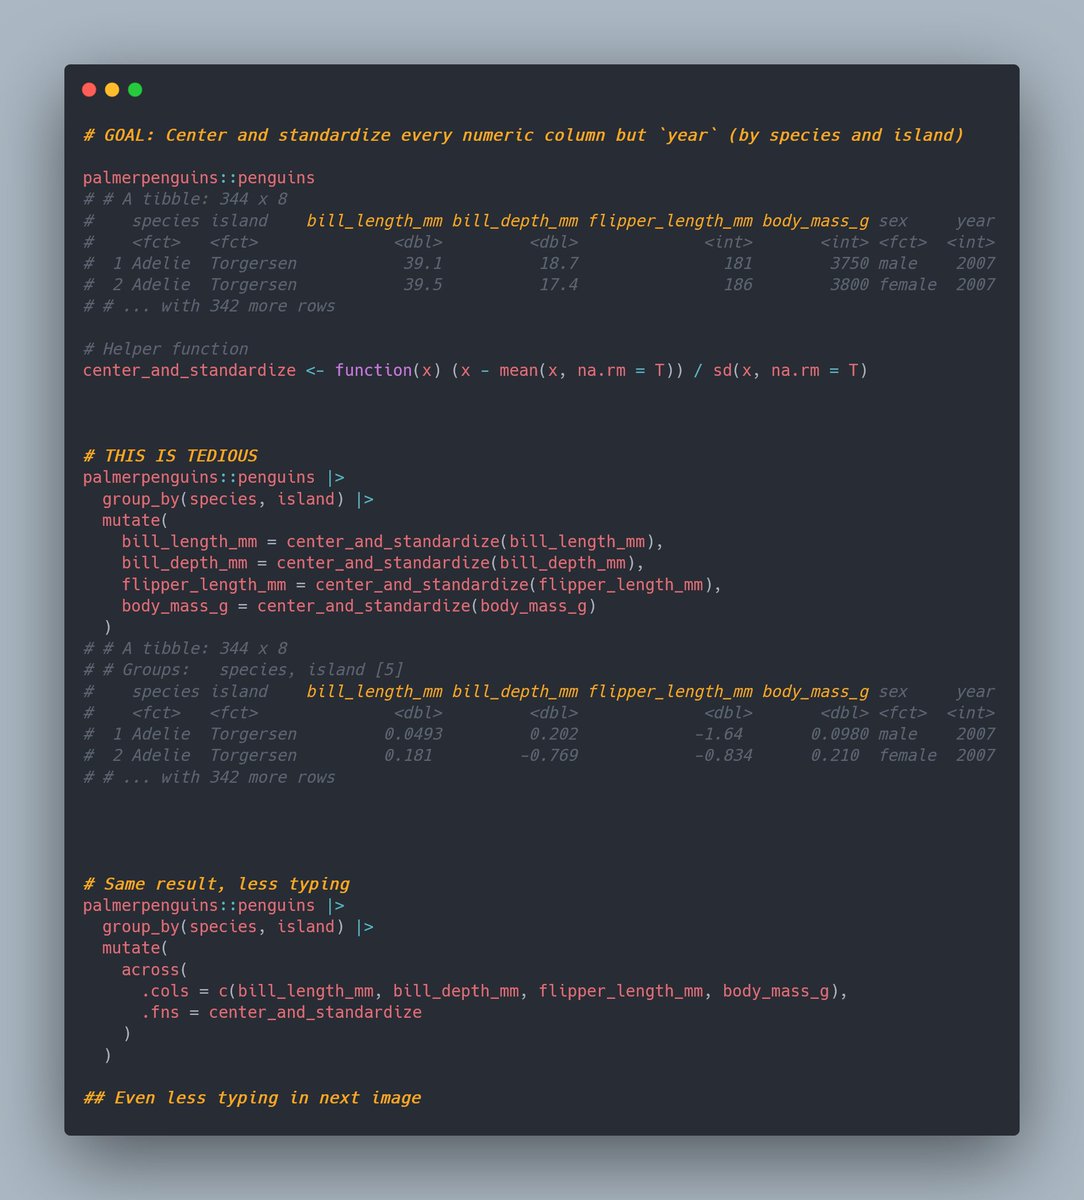
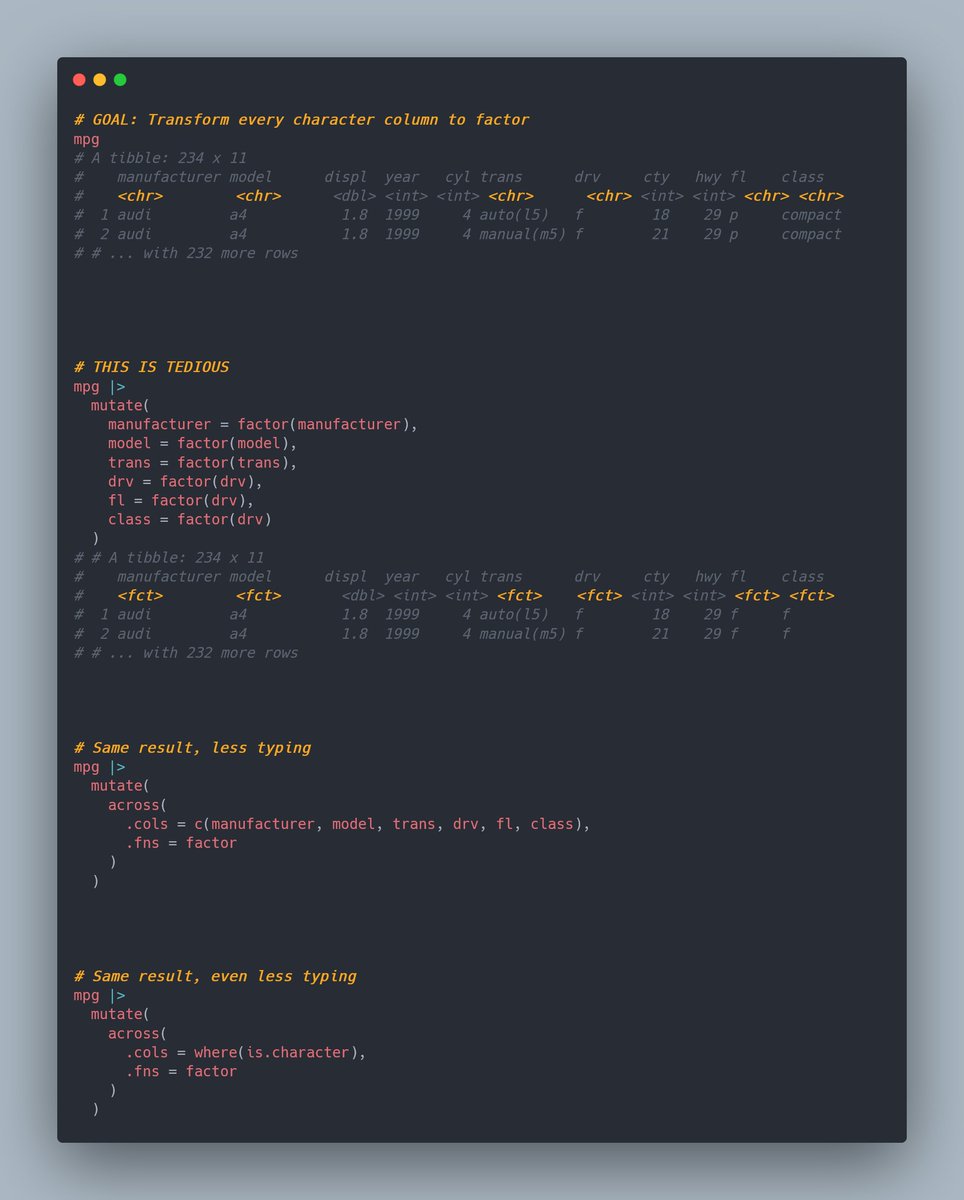
Frighteningly powerful #rstats combo:
mutate() + across() + {tidyselect} helpers 💥 🤯
But the syntax may be a bit confusing at first. So, here are a couple of simple examples.
(With editable code plus meme below)
NumPy vs Pandas!!!
Pandas is built around column major format.
A subtle point that lot of us don't pay attention to & it leads to misuses of Pandas 🐼
Read more... 🧵👇