How did I manage to maintain an 85% win rate during this drop, anticipate the bear market three months ago and exit my spot positions, taking only one loss in the process and six wins, all live?
Here are the strategies I use to avoid missing the next bottom and to stop longing every higher low on $BTC
This year, @tradingview reached out again to give away four annual TradingView subs (Ultimate, Premium, Plus, and Essential, one of each)
To qualify, just like this post and comment your TradingView username under it, and make sure I can DM you.
I will DM the winners on the 26th.
The chads over at @TradingView gave me an Ultimate and Premium subs to give away as they celebrate their Black Friday sale (80% off and 1 free month!)
It's simple, all you have to do is like this post and reply with your TradingView username
Winners will be chosen on the 27th
🚨 I've got a giveaway for my followers! 🚨
I'm giving away FOUR @tradingview memberships to celebrate their awesome black Friday deals.
One of each plan:
Ultimate, Premium, Plus, Essential
How to enter:
- Retweet
- Like
- Comment
Random winners announced on Monday!
I’m giving away an Ultimate ($2K+) and a Premium ($500+) TradingView subscription!
To participate just follow me and comment below (I'll immediately block bots and fake accs)
Picking the winners in the next 48 hours
(Thank you to @TradingView for offering these!)
6/6 on the shorts, Massive wins ✅and update
This is Exactly How We've Shorted $BTC Live and Anticipated Every Move for Weeks, While Everyone Else Was Longing Every Bounce
Another successful analysis [Data and macro simplified]
This is the exact same process we've been executing for the past couple of weeks:
Wait for resistance, confirm with flows and structure, then execute.
No losses so far, just systematic winners.
And this is precisely why 99% of traders lose money: they long support flips without higher-timeframe confirmation, chase mid-range moves with no invalidation levels, and get shaken out by noise instead of waiting for institutional confirmation.
They trade what they hope will happen.
We trade what structure and flows tell us is happening.
That’s the difference between guessing and having an edge.
No need to force anything here. The trade worked, targets are hitting, and we wait for clear confirmation before the next move. That’s disciplined trading.
Everything played out exactly as expected:
Price rallied to $103.5K, ETF flows turned negative that morning (–$278M on Nov 12), and we got our H4 bearish shift right at resistance.
Clean rejection, structure break below $101K, and here we are at $98.4K, with the first target already hit.
Current Metrics & What’s Next
Price: $98,400 (–5.1% from entry)
CVD: Still negative (–90K general, –43K spot) → sustained selling pressure
Funding Rates: 0.0048% → trapped longs still haven’t capitulated
Open Interest: Down from $37B peak to $32.5B → position unwinding continues
ETF Flows: Negative momentum confirmed, institutions distributed at resistance
The structure is clear: bearish momentum intact, no signs of reversal, path remains downward.
What’s Next
Current level (~$98K) is a point of interest, but not necessarily the bottom.
$93K is the next major target—that’s where we’d expect potential institutional accumulation and the first meaningful reversal signals.
Key confirmations to watch:
Funding rates turning negative (short overcrowding / capitulation)
High-volume panic selling (climax behavior)
ETF flows flipping to strong inflows while price drops
H4 bullish structure shift at major support
Until we see these signals, the bias stays bearish.
For now, we’re sitting on solid profits from the 115k, 110k, 103k entry and scalps, so enjoy the win, stay patient, and wait for the next high-probability setup.
This is not the moment to look for new longs or shorts. It’s a moment to reevaluate:
What did I do wrong? What could I have done better? Who have I been listening to?
Use critical thinking and hit reset on both your system and yourself.
Next update soon
Adez
$BTC Update – November 12, 2025
Another successful BTC analysis for the books ✅
This is why 99% of traders fail and the next plan:
I saw a lot of people earlier longing the flip of the so, called support and resistance zone. The reality is this: your S/R zone means nothing if your higher-timeframe bias isn’t aligned.
You need the weekly and monthly charts flowing in the same direction, otherwise, you’ll end up longing a daily wick, mistaking it for a reversal, just because lower-timeframe noise threw you off.
The plans were clear, and we had multiple chances to enter, so what’s next?
Current Market State
Price: $101,770
Previous Local High: $105,297
Pullback: ~3.3% from peak
1. Cumulative Volume Delta (CVD)
General CVD: -397K (red line declining)
Spot Aggregated CVD: -361K (red line declining)
What this means:
Sustained net selling pressure since October highs. Large players (institutions/whales) have been offloading while retail likely accumulated.
This is classic distribution.
2. Funding Rates
Current: 0.0054 (0.54%)
Historical context: Spikes to 0.015-0.02 marked previous tops at $114K and $105K
Key observation: Still positive but moderate
What this means:
Longs are still paying shorts, meaning most traders remain net-long despite the drop. No capitulation yet, trapped longs haven't been flushed out.
3. Open Interest (OI)
Current OI: $32.5B (shown in blue box comments, bottom left)
Recent trajectory:
Peak: ~$37B (late October, around price top $114K)
Current: $32.5B
Net decline: ~$4.5B (~12% drop)
ETF flows:
Critical observation:
Heavy institutional selling Oct 29 - Nov 7 (aligns with price drop from $114K → $101K)
Strong reversal inflow Nov 11 (+$524M) – this is significant
This could be:
A) Smart money buying the dip
B) Short-term bounce before continuation lower
My Specific Recommendation for You
Stage 1: Next 48 Hours (Stay Flat, me)
Monitor ETF flows on Nov 12-13
Watch $100K level closely
If clean break below $100K → move to Stage 2A
If bounce starts → move to Stage 2B
Stage 2A: Breakdown Confirmed
Short retest of $100K as resistance
Target $35-98K
Stop above $102K
Size: 50% normal position
Stage 2B: Bounce Develops (Most Likely)
Wait patiently for $103-106K
Short on clear rejection with:Bearish H4 candle closes
Resumed ETF outflows
Funding spike showing renewed speculation
Targets: $98K → $95K → $90K
Stop: $107-108K
Size: Full position (better setup)
Stage 3: If Wrong (Breakout Above $110K)
Wait for new setup, checkout YouTube video for the overall breakdown.
Which scenario am I following, and exactly in more detail? In the comments of this post there’s a YouTube video, I upload weekly videos to my Telegram group for free.
Small update on $BTC
Our main zone was reached and we got the exact H1 confirmation we were looking for.
Funding Rates: Remain positive (~0.007–0.01) even after the drop, meaning most traders are still net-long. Each previous funding spike above 0.015–0.02 has coincided with local tops around 114K and 105K
No negative-funding reset yet, longs haven’t capitulated.
Open Interest: Declined from ~37B to ~32B as price pulled back. That’s long positions closing, not new short exposure. The falling OI while price holds near highs forms a typical bearish divergence.
Combined View: High funding + falling OI usually signals distribution, trapped longs being off-loaded, not fresh demand.
Conclusion:
The 106-107K zone likely marked a local top.
I’m already short, H4 shift is loading to add.
Tired of missing the reversals on weekly and monthly basis? Pin and read this.
Between 2020 and 2025, Bitcoin pivot points haven’t been random at all.
Data shows clear temporal bias:
Weekly highs: 29.4% occur on Mondays — over 2.6× more than expected by chance.
Weekly lows: 37.1% also fall on Mondays, again >2.6× above uniform expectation.
Monthly lows: Nearly 42% happen within days 1–5 of each month
Chi-square tests confirm strong deviation from randomness (p < 0.001).
In short: markets tend to reverse early in the week and early in the month.
If you trade BTC swings, Monday and the first few days of the month are statistically loaded with pivots, not coincidence, but patterned behavior across five years of data.
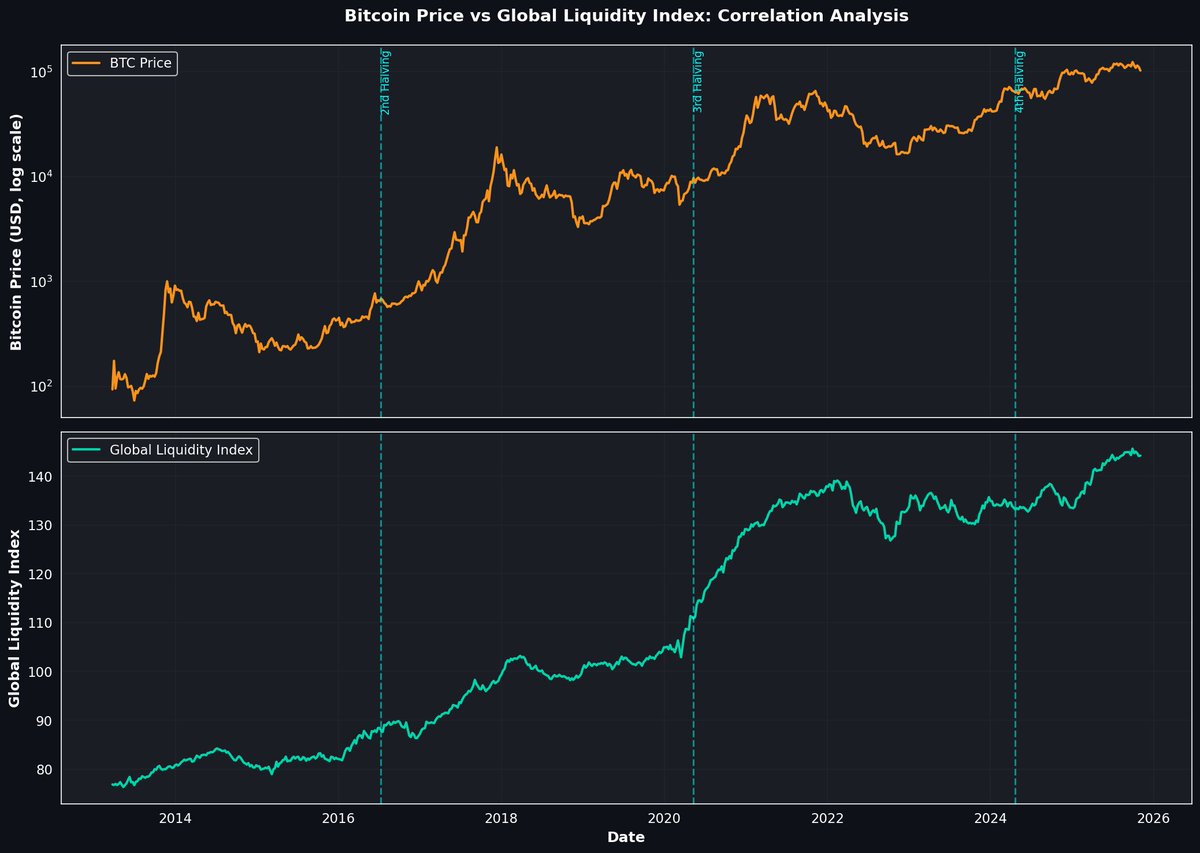
Bitcoin Market Cycle Analysis
This Is The Data You Need To See To Avoid Getting Trapped In A Bear Market:
A Critical Examination of the data on Liquidity vs. Halving Narratives
A new thesis dominates crypto discourse: "Halvings are obsolete, only liquidity drives Bitcoin, the bull market extends into 2026 or longer."
But when institutional market makers synchronize this exact narrative, we must examine data, not consensus.
Let's analyze rigorously:
Asymmetries in trading education: the hidden denominator problem
A 5 minutes read that could save you some years navigating here.
Taking as a case example the 2 million dollar payout from a trader and why you will likely not be able to replicate it.
First month back and....
4,000 new guys, 82% win rate on all trades shared live, complete with plans, reasoning, entries, and stop losses, and coded some new indicators that I’ve been sharing on Telegram, good start.
Thanks!
Quick Fundamental Update: ETF Flows
Some more insights on BTC ETF flows and stablecoins with actionable levels:
Why ETF Flows Matter Now:
This year, ETF flows have become one of the fundamental metrics I track religiously
Why? Because since the ETF approval in January 2024, institutional money flow is no longer a black box, we can literally see when big players are buying or distributing in real-time
October's pullback is clearly reflected in the data:
5-day: -$799M 🔴
30-day: -$1,750M 🔴🔴
Signal: -2 (strong outflow)
Translation > Institutional money is getting out, this isn't retail panics, it's coordinated distribution from the big players
Actionable Levels (when fundamentals flip):
$104-106K Zone:
Wait for: ETF inflows >$300M/day
Stablecoins: Minting acceleration
Technical: OI <48K, Funding negative or cvd divergences / shift in structure /
$98-102K Zone (A+ setup):
Wait for: ETF inflows >$500M/day
Stablecoins: >$1B weekly mints
Technical: Full flush (OI <45K) / cvd divergence / shift in structure
In the last post you know the plans I'm watching exactly. This just helps put it into a cleaner perspective, the overall levels where we want to wait for reactions, shifts in structure, and changes in data
This doesn't mean price won't continue ranging, just that my preferable side to be on the market is the short side
Personally, as I mentioned, I'm skipping until Monday, or just waiting for the short levels to continue adding.







![adezresearch's tweet photo. 6/6 on the shorts, Massive wins ✅and update
This is Exactly How We've Shorted $BTC Live and Anticipated Every Move for Weeks, While Everyone Else Was Longing Every Bounce
Another successful analysis [Data and macro simplified]
This is the exact same process we've been executing for the past couple of weeks:
Wait for resistance, confirm with flows and structure, then execute.
No losses so far, just systematic winners.
And this is precisely why 99% of traders lose money: they long support flips without higher-timeframe confirmation, chase mid-range moves with no invalidation levels, and get shaken out by noise instead of waiting for institutional confirmation.
They trade what they hope will happen.
We trade what structure and flows tell us is happening.
That’s the difference between guessing and having an edge.
No need to force anything here. The trade worked, targets are hitting, and we wait for clear confirmation before the next move. That’s disciplined trading.
Everything played out exactly as expected:
Price rallied to $103.5K, ETF flows turned negative that morning (–$278M on Nov 12), and we got our H4 bearish shift right at resistance.
Clean rejection, structure break below $101K, and here we are at $98.4K, with the first target already hit.
Current Metrics & What’s Next
Price: $98,400 (–5.1% from entry)
CVD: Still negative (–90K general, –43K spot) → sustained selling pressure
Funding Rates: 0.0048% → trapped longs still haven’t capitulated
Open Interest: Down from $37B peak to $32.5B → position unwinding continues
ETF Flows: Negative momentum confirmed, institutions distributed at resistance
The structure is clear: bearish momentum intact, no signs of reversal, path remains downward.
What’s Next
Current level (~$98K) is a point of interest, but not necessarily the bottom.
$93K is the next major target—that’s where we’d expect potential institutional accumulation and the first meaningful reversal signals.
Key confirmations to watch:
Funding rates turning negative (short overcrowding / capitulation)
High-volume panic selling (climax behavior)
ETF flows flipping to strong inflows while price drops
H4 bullish structure shift at major support
Until we see these signals, the bias stays bearish.
For now, we’re sitting on solid profits from the 115k, 110k, 103k entry and scalps, so enjoy the win, stay patient, and wait for the next high-probability setup.
This is not the moment to look for new longs or shorts. It’s a moment to reevaluate:
What did I do wrong? What could I have done better? Who have I been listening to?
Use critical thinking and hit reset on both your system and yourself.
Next update soon
Adez](https://pbs.twimg.com/media/G5qCyrvXEAAT2VM.jpg)