Sanjay is R&D Director in Data Visualization at SAS Institute, responsible for ODS Graphics, Graph Template Language, SG Procedures and ODS Graphics Designer.
@elonmusk. I am a huge fan and Model S owner. Trying to buy another Model S, but getting horrible customer service. Clearly, your staff is over worked selling Model 3s.
@elonmusk Display of proximity to other cars on the dash is nice. It may be even better in a "Heads-up" display, thus avoiding the need to look down. Any chance of a "Heads-up" display option in the future?
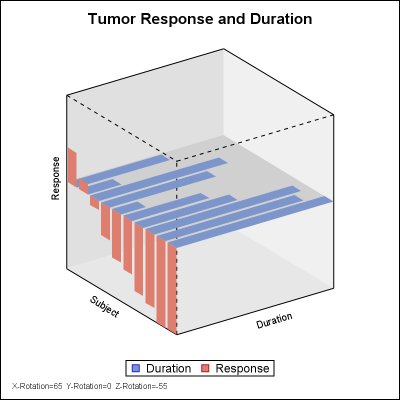
New blog article on a macro for creating a 3D Waterfall Chart using SAS and a better alternative. #SASUSERS, #SASTIP, #Dataviz, #SASSOFTWARE. https://t.co/p4EGqliau7
@RickWicklin Rick makes a good point. When a user asks how to do A, you can reply with a better alternative. Often it is more effective to show user how to do A, and then suggest a better approach. :-)
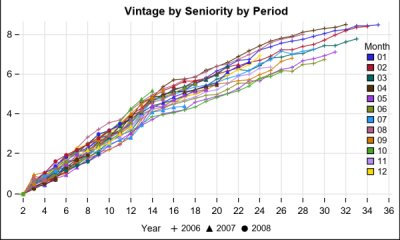
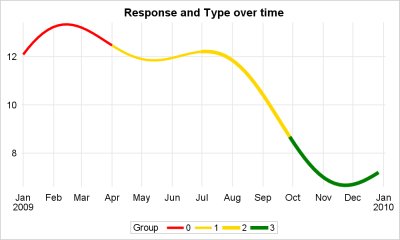
Create series plots with varying attributes or colored along the curve by a response variable using #SASSOFTWARE. #SAS, #SASTIP, #SASUSER. https://t.co/lpvwyX2y6L