Hey folks, if you're following other projects on other sites, you can also find us at:
* https://t.co/3PcMRWgWBm
* https://t.co/jNO42u73J7
* https://t.co/lnHdG4mog9
Tree-based gradient boosting is an ensemble method that builds a powerful prediction model by sequentially adding weak learners (often decision tree stumps). 🌲📈
To help my students really get it, I built a #Python@matplotlib interactive dashboard 🚀🐍
Step through each stump and watch the model update as the residuals and error evolve in real time! 🔥🎯
#MachineLearning #DataScience #AI #Python
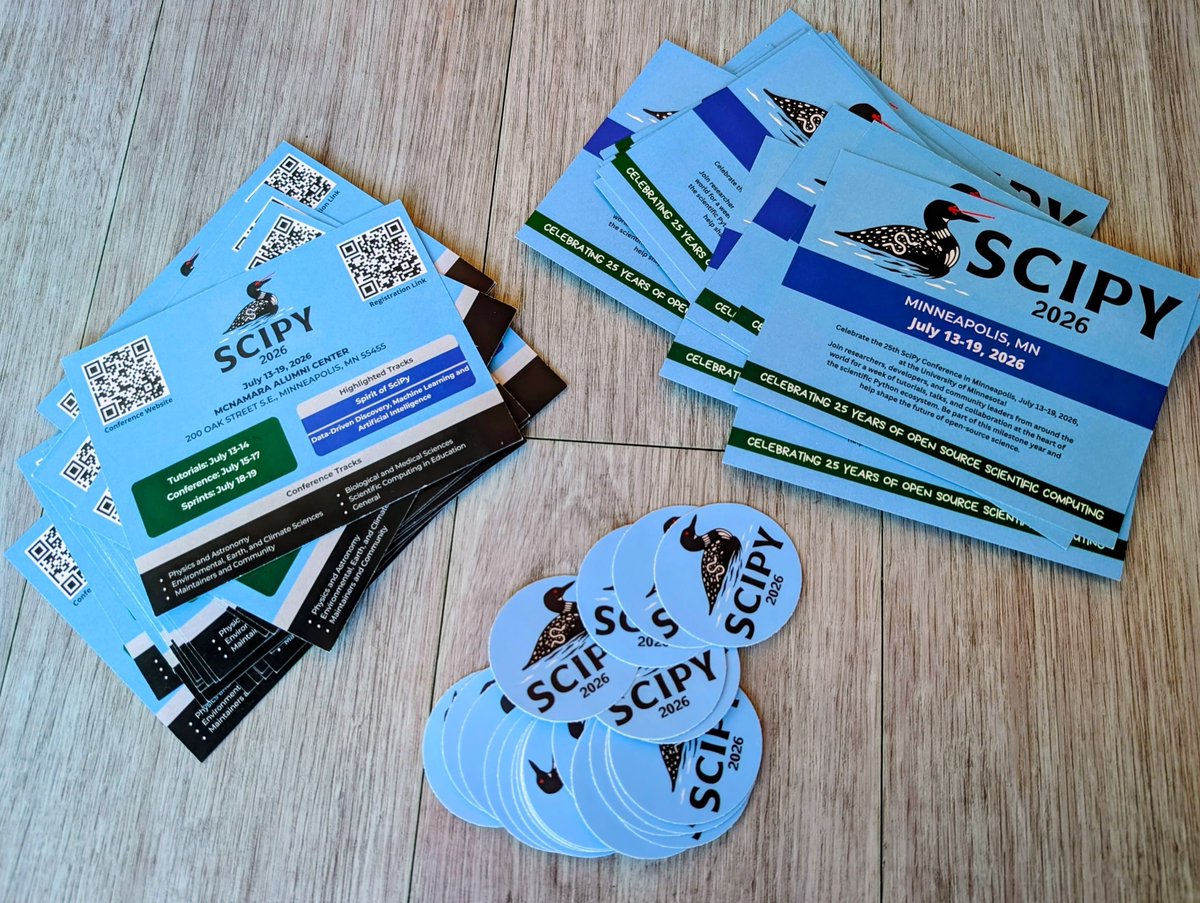
📣 If you’re at #PyConUS2026 next week, catch @InessaPawson
and @juanitagomezr at the Community Showcase on Sunday with flyers and stickers for #SciPy2026! 🙌
If you have questions about the conference or just want to connect with the community, this is your chance 🎉
mlpack received $300K from the Sovereign Tech Agency to strengthen open-source ML infrastructure.
Over the next 18 months, you can expect: modern GPU backends, ONNX support, better Python/R/Julia bindings, DuckDB + Arrow integration, and more.
Read more on the NumFOCUS blog: https://t.co/UWfoyi5Sp2
I’m stoked to teach density-based cluster analysis to my students! 🔥
Agglomerative clustering is a bottom-up hierarchical method: each point starts as its own cluster, then pairs of clusters are repeatedly merged based on similarity until one tree of clusters (a dendrogram) is formed 🌳
Very intuitive—it mirrors how we naturally perceive structure—like pointillism 🎨, where meaning emerges by progressively merging nearby points of similarity into coherent patterns!
To help my students visualize density-based cluster analysis, I built an interactive #Python dashboard with @matplotlib 📊🚀
We have a pre-release we'd love y'all to test! Especially if you use non English scripts - a major part of this release is the overhaul of text and font processing to support modern font features, enabling full internationalization in all languages.
https://t.co/iNqIMuY23i
A degree-100 polynomial p. Color each point z of the plane by arg(p(z)). The zeros are the points where the full color cycle closes on itself. Let the roots drift, and the colors flow with them. Made with #python#numpy#matplotlib in a @marimo_io notebook.
Skąd najlepiej widać Tatry?
Analiza widoczności 329 szczytów Tatr (>2000 m n.p.m.) w promieniu 50 km. Dla każdego z 222 tys. heksagonów obliczono line-of-sight na modelu terenu Copernicus DEM 25m.
@matplotlib@GdalOrg
I taught Claude Code to make beautiful @matplotlib charts!
I Built an opinionated skill for publication-quality figures, in a style that I like. It's a work in progress and I hope others will contribute. github link below 👇
We've recently released many new features that improve the developer experience for computational research, ML, and AI, including a native reactive @matplotlib element, PyTorch formatters, and remote storage inspector.
Learn more in our latest video:
https://t.co/s7NebN9hFl
Take a few minutes to complete the 2026 Python Developers Survey and help us map out an accurate landscape of the Python community! #python#pythondevsurvey
https://t.co/uylntO7Z9Z
This week I told my students a hard truth:
Your spatial data is probably biased,
and yes… that means your statistics, and your models, and your decisions may be biased too.
But I had good news!
We can mitigate this with spatial declustering.
To make sure they really understood, I built a new interactive #Python @matplotlib dashboard yesterday.
Here’s what we explore:
✳️Sample on a regular grid (representative sampling) → the estimate converges to the true mean.
✳️Add infill samples in “good” locations → the mean becomes biased.
✳️Apply declustering weights → the statistics become far more robust under variable sampling density.
You can experiment with it yourself. I just shared the full workflow on my #GitHub @ https://t.co/lAJaoNyGJh.
Education changes lives. Let’s make spatial models better. #DataScience
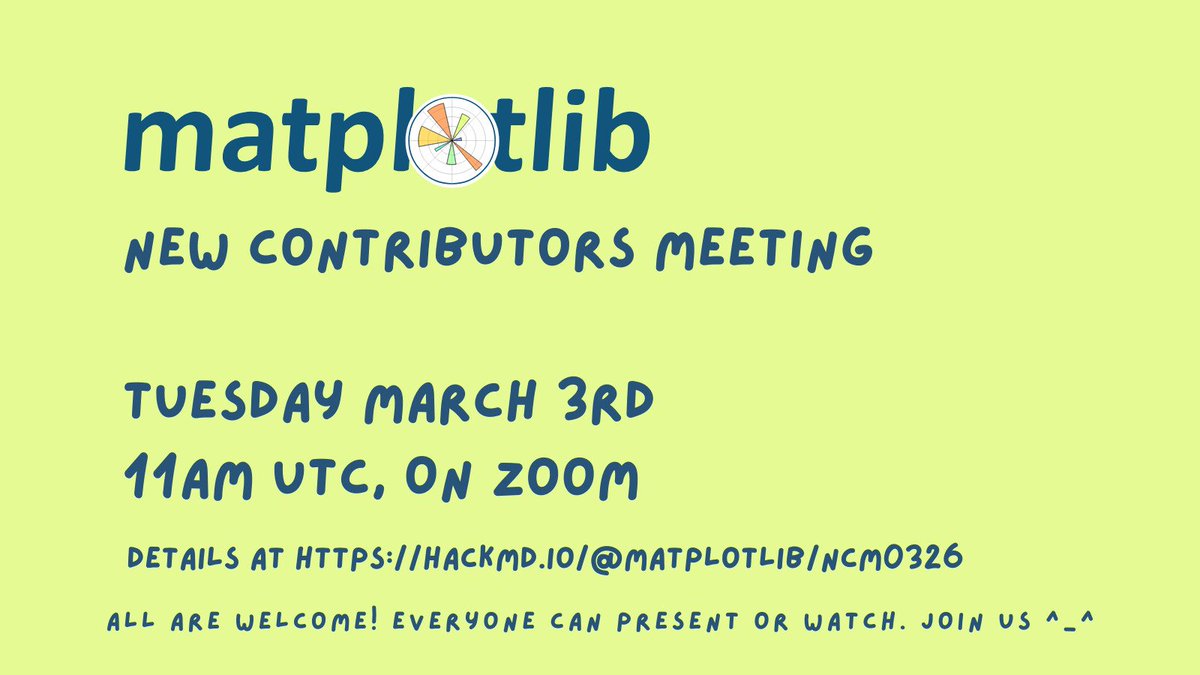
Hey folks! Interested in GSOC? Unclear how to use AI properly? Want to contribute and it's all feeling a little ?! Join us for our monthly new contributors meeting and ask all the questions!
Our latest release brings richer interactivity to machine learning and scientific computing workflows, including reactive @matplotlib plots, a matrix UI element, a native rich visualizer for @PyTorch modules, and a thread-safe progress bar for parallelizing work.
(1/n)
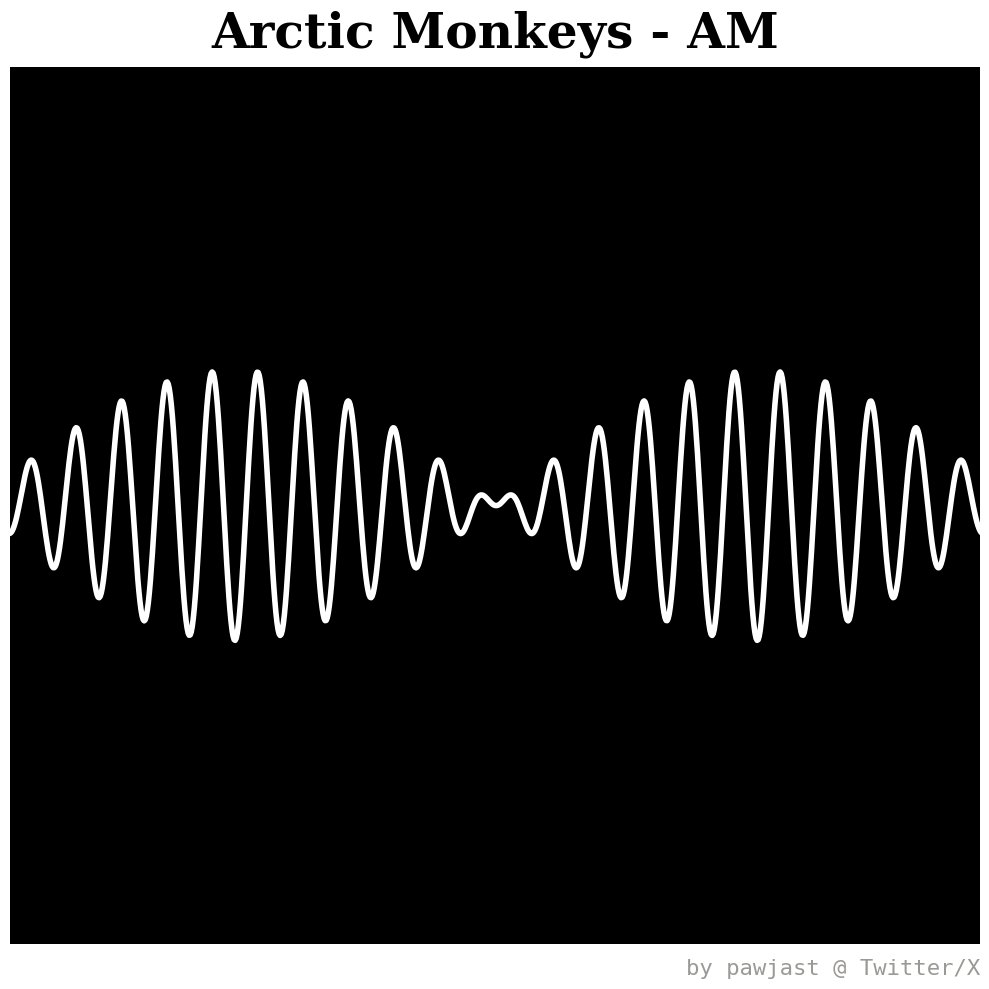
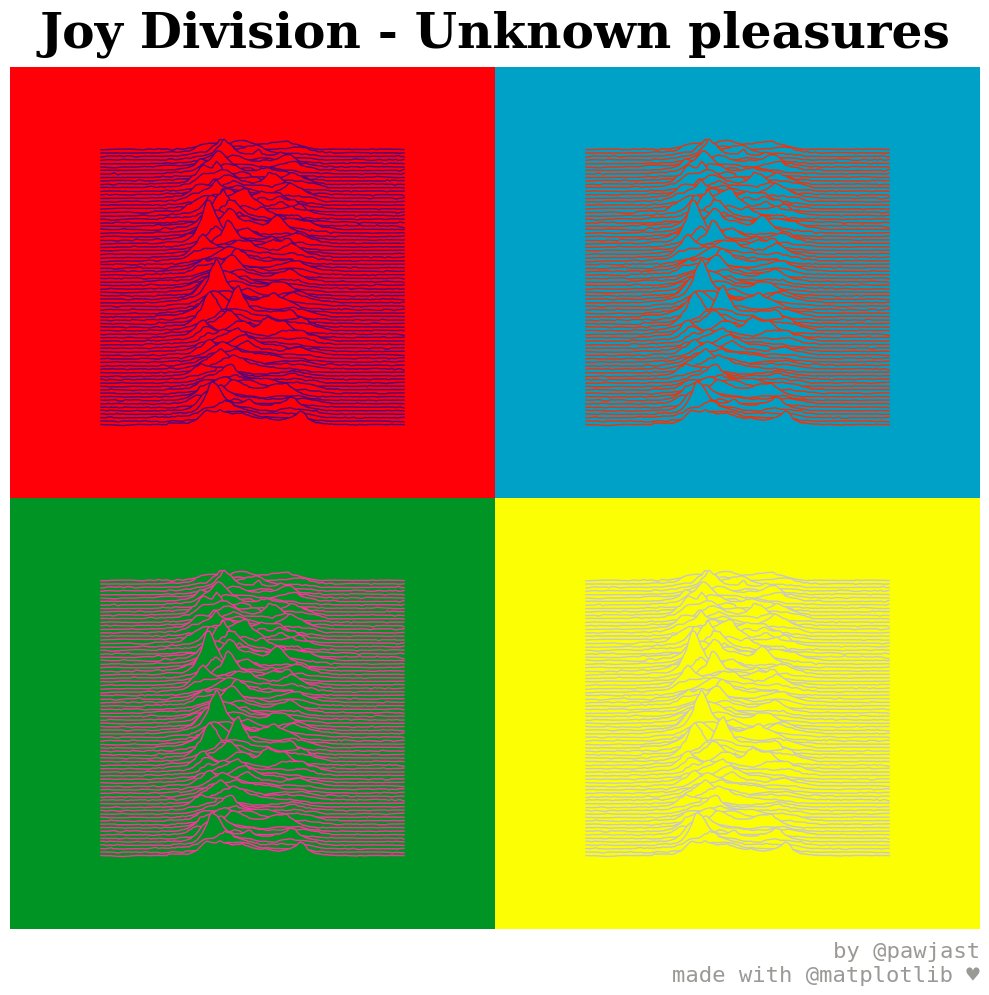
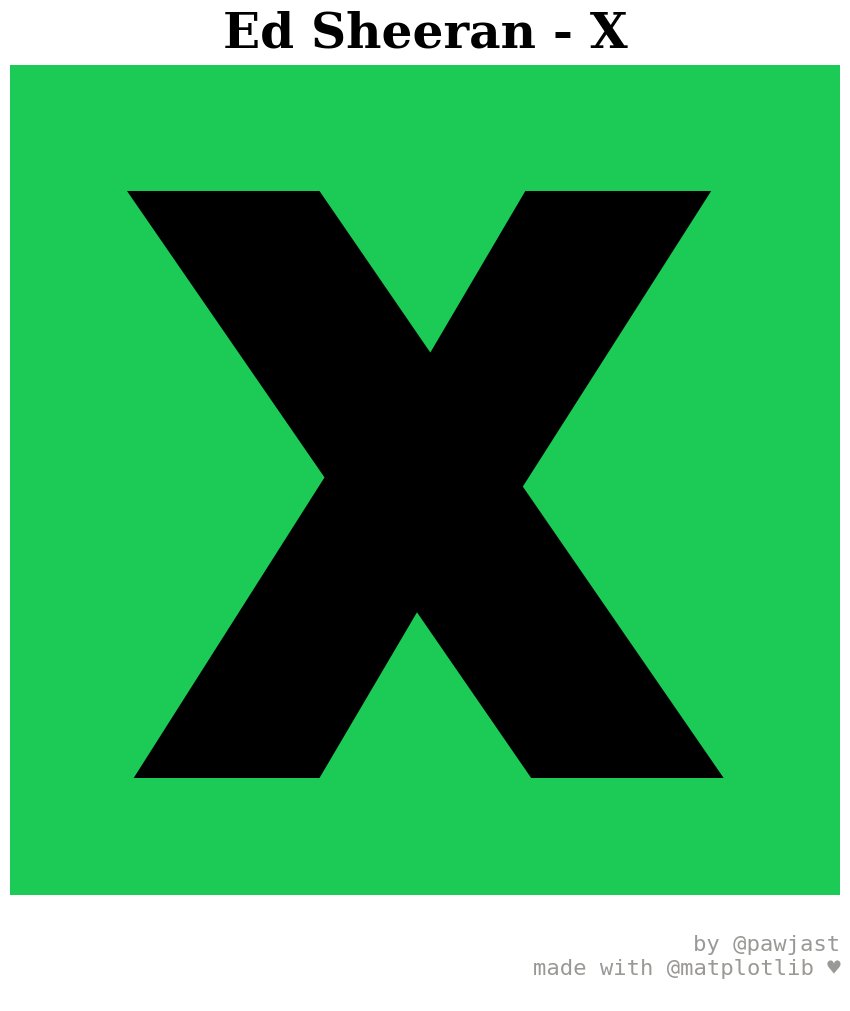
There was a time I was recreating music album covers in @matplotlib for fun.
I should get back to it.
What cover do you think is a good material for a "plot😉"?