How this account works:
Before a company reports, we post the numbers we're scoring it on and what would kill the idea.
After it reports, we quote that post with the result, checked against the SEC filing. Misses too.
Positions disclosed. Not investment advice.
Fact or fiction: Alphabet just disclosed 4 new positions in its Q3 13F.
On paper, yes: its 13F, filed Nov 6, lists four holdings that weren't on the last one. None of them looks like a purchase. All four trace back to bets by GV, Alphabet's venture arm:
• Lime: GV led its 2018 round. IPO in July
• Freenome: GV joined its 2017 Series A. Listed in July through a merger
• Obsidian Therapeutics: GV led its 2017 Series A. Listed in August through a merger
• Qualcomm ($548M): Qualcomm bought Modular, a GV-backed AI startup, and paid in stock. GV's funds received about 3.2M Qualcomm shares
The line the list skips: Alphabet's biggest 13F holding is SpaceX, $83.7B of the $88.3B in the filing.
Half fact. True on paper, but on a 13F a "new position" can just mean a startup that got listed or bought.
No position.
#13F #stocks
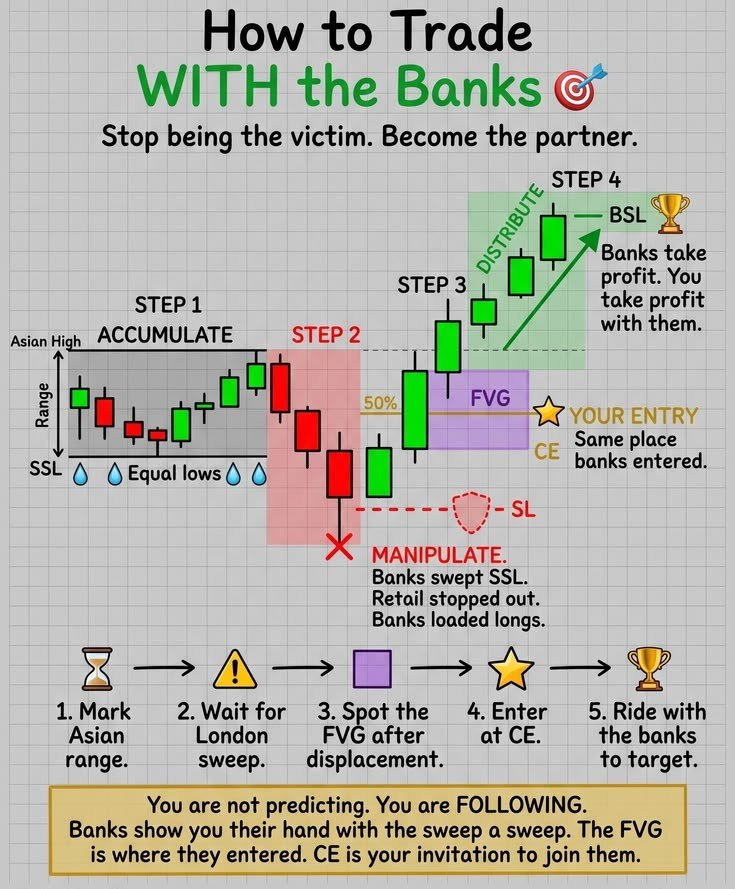
Fact or fiction: "How to trade WITH the banks." Mark the Asian range, wait for London to sweep it, find the fair value gap, enter at its midpoint, ride to the other side of the range.
Bitcoin and Ether, every day from Aug 2024 to Jul 2026 (Binance minute data), rules written down before we ran it. Stop beyond the sweep, as drawn. 860 setups:
• Reached the target: 13%. Stopped out: 84%
• Average trade: −0.01R before fees (R = the amount risked), no better than the same stop and target at the same minute on a random day
• After Binance's standard 0.1% fee each way: −1.32R a trade. The stops are so tight (median 0.19% on BTC) that fees average 1.3R a trade
• Longs −0.14R, shorts +0.10R. Neither cleared chance. A fixed 2R target instead: −0.09R
Fiction. The account also trades gold, which we couldn't test (no minute data).
#bitcoin #daytrading
Appreciate that. On where the pin sits, we posted a test of one version yesterday: the SPY strike with the most open interest expiring within a week. From 1 pm ET, if SPY was within 0.30% of it, trade toward it into the close. Held-out year: 21 trades, +0.12% a trade, t = 1.64. A lean toward the pin, short of our bar: https://t.co/MnXKlUGJI4
Tomorrow's 9:30 to 11:30 range goes up either way.
Gamma's in the air, so a related one from our graveyard: the dealer "gamma pin."
The idea: dealers hedging the heaviest open-interest strike pull SPY toward it into expiry. We tested it on a held-out year (Aug 2025 to Jul 2026): from 1 pm ET, if SPY was within 0.30% of that strike, trade toward it, out at the close.
21 trades: +0.12% a day, t = 1.64. It leaned toward a pin, but didn't clear our bar.
Fact or fiction: with little SPY gamma expiring tomorrow, "46.5 points of movement tend to arrive before lunch" on SPX.
The arithmetic holds up, but it doesn't need gamma. The 46.5 is 55.5% of the options-implied one-day move (83.8 points). On SPY from Jul 2024 to Jul 2026, the median morning's high-to-low range (9:30 to 11:30 ET) was 54.5% of the VIX-implied one-day move. That's a typical morning.
How often a range that size (0.61%) prints before 11:30:
• All 501 sessions: 54%
• After a VIX close between 16 and 19 (today's: 17.49): 49%
• Thursdays: 61%
Half fact. The number describes an ordinary morning; none of its inputs measures what expires. Tomorrow also opens on whatever Nvidia's board decides. We'll post SPX's 9:30 to 11:30 range either way, but one morning can't settle the gamma part.
#SPY #options
Nobody tells beginners this about where gamma expires.
At 4:00 PM today, 26.2% of all tracked dealer gamma on $SPY dies in one print. Tomorrow only 3.4% expires, so tomorrow morning you trade a market whose anchor was mostly removed overnight.
They see "a slow afternoon that won't break out."
A tiny group of vol desks sees which expiry holds the hedging weight, and how fast that weight runs off.
Gamma is how fast an option's delta changes. Delta is the number of shares a dealer must hold to stay hedged. Dealers, the market makers on the other side of your options, re-hedge every time price moves. They are forced to trade by how much gamma sits on the board and on which date it expires.
The book, estimated from SPY open interest (contracts still open), shows net GEX of +0.56B. GEX is total dealer gamma exposure. Positive means dealers sell strength and buy weakness, which pins price.
Same tape. Same quiet candles. One trader sees a pin that lasts. The other sees a pin with a 4:00 PM expiry date.
The difference isn't the indicator. It isn't the timeframe. It's which day the gamma expires.
Here's the stack, date by date →
WHERE THE GAMMA SITS:
→ Nov 11, today: 26.2% of dealer gamma. This is the heaviest single date. That's not random chop. That's dealers hedging the biggest slice of their book.
→ Nov 12, tomorrow: 3.4%. That's not a calm day. That's a missing anchor.
→ Nov 13: 13.6%. The pin force partly reloads two sessions out.
→ Nov 20, monthly OPEX (options expiration): 25.3%. This is the second heavy stack of the week.
→ Dec 18: 19.3%, too far out to grip today's price.
WHAT THE AFTERNOON RUNOFF DOES:
→ 14:35 ET: the at-the-money straddle (a call plus a put at the current price) costs 14.3 SPX points, about 1,434 dollars per SPX-size straddle. That is only 0.17x the 83.8-point expected move. That's not cheap insurance. That's gamma being squeezed into the last 85 minutes.
→ SPY 775, SPX 7,772: the call wall, the largest call strike. Dealer selling there tends to slow rallies. It sits 209.4 points above the 7,562.8 shelf, too far away to cap anything today.
→ SPY 730, SPX 7,321: the put wall, where dealer buying cushions dips. It sits 158.1 points below the 7,479.0 shelf.
→ 4:00 PM: the 26.2% expires. Every hedge tied to it is unwound or released. That's not the close. That's the pin's expiration date.
WHAT CHANGES TOMORROW:
→ 9:30 AM: only 3.4% of gamma expires that day. Less same-day hedging means less force pulling price back toward the strikes.
→ Flip line, SPX 7,817.7: this is the level where dealer hedging reverses direction. Spot SPX at 7,626.2 sits 191.4 points below it, which the model flags as FAST. Net GEX is positive on paper, but price is trading in the zone that moves.
→ 7,626.2 already trades above 7,604.8, the top of today's priced range. With the expiring anchor gone, the walls at 7,772 and 7,321 are the nearest structure.
Now the part retail never computes.
26.2% + 3.4% = 29.7% of tracked dealer gamma expires in the next 2 sessions, with 26.2% of it today.
7,520.93 x 0.1769 = 1,330.45
1,330.45 / 15.87 = 83.8 points of expected move (the one-session move the options price in)
83.8 x 0.5 = 41.9 points
83.8 x 0.555 = 46.5 points tend to print before 11:30 AM
83.8 x 2.236 = 187.5 points for the week
→ Half-EM shelves: 7,479.0 and 7,562.8.
→ Full daily range: 7,437.1 to 7,604.8.
→ Weekly corridor: 7,333.5 to 7,708.4.
→ Morning budget: 46.5 points before 11:30 AM, with almost no same-day gamma to slow it.
A pin read WITH a heavy same-day expiry share behind it is dealers forced to lean on price. A pin read without it is the trap that sells you a range on a 3.4% day.
The trader staring at today's dead afternoon is watching 26.2% of the book run off. Tomorrow that weight is gone, and 46.5 points of movement tend to arrive before lunch.
The candles show you where price rested.
The expiry stack shows you how long it can rest there.
Map the expiry share, the walls and the shelves before every session.
With only 3.4% of dealer gamma expiring tomorrow, is your first trade before 11:30 AM built for a pin or a run?
I put the dealer gamma walls, flip-line and confluence playbook into a playbook.
Follow me (I can only send it to followers) and comment "WALLS" below, and I'll send it to you.
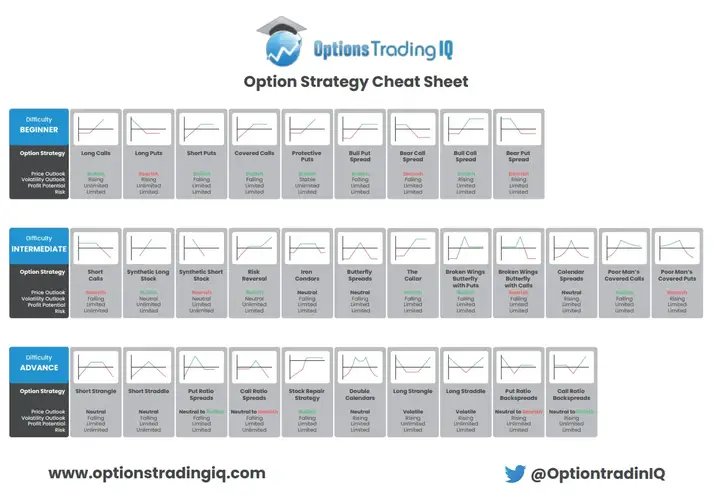
Fact or fiction: this options cheat sheet.
The payoff shapes look right. Two labels are wrong:
• Long puts, profit: "Unlimited." A stock can't fall below zero, so a $100 put bought for $2 makes at most $98
• Put ratio backspreads, profit: "Unlimited." Same reason
The sheet even contradicts itself. Synthetic short stock also gains as the stock falls to zero, and there the profit is "Limited." So is every loss that stops at zero: short puts, covered calls and four more.
The bigger trap is the word itself. A call bought for $2 has limited risk: $2. A $100 put sold for $2 also has limited risk: $98. Same label, 49 times the money.
Mostly fact. "Limited" tells you there's a floor, not how far down it is.
#options #optionstrading
Fact or fiction: if the opening 30-minute candle moves hard one way, takes out the overnight high (or low, on a down move), and leaves a fair value gap, "the direction is set. Trade with it."
SPY and QQQ, Aug 2024 to Jul 2026, rules written down before we ran it. "Hard" = a body at least half the candle's range, and a range at least the prior 20 days' median. 152 setups (75 SPY, 77 QQQ):
• The rest of the day (10:00 to the close) went the called way 59% of the time. Up calls 66%, down calls 53%
• Average +0.26% before costs, short of our bar. The same hours on an average day: about 0%
• The trade, in at 10:00 and out at 11:00 (the post gives no stop or target levels): right 54%, about zero. Calling it at 9:45 on the first 15 minutes instead (71 setups): right 49%, −0.11%
• 100 heavily traded US-listed stocks, 6,856 setups: the rest of the day went the called way 52% of the time. Average +0.18% before costs, against about 0% for the same hours on an average day. Small but real; up and down calls both leaned the right way
Fiction, by the bar we set. The post says the open tells you "EVERYTHING about what's going to happen the rest of the day." It went the called way 59% of the time. Openings without a big move were quieter by the median, but over a third of them still moved more than a typical big-open day.
#daytrading #SPY
There's a 90-minute window every single trading day where the market basically tells you exactly what it's going to do…
Miss it and you're guessing for the next 5 hours
Catch it and you can close your laptop before lunch
95% of retail traders have never heard of this. The 5% who know it guard it like a trade secret.
Here's what gurus doesn't teach you:
The 9:30-11:00 AM window isn't just "market open"
It's when institutions reveal their hand
Big money can't hide. When Goldman or Citadel or any major fund needs to move size, they HAVE to do it when liquidity is highest. That's the first 90 minutes.
If they're buying, price expands up from the open
If they're selling, price expands down from the open
If they're not doing shit, price chops sideways
That expansion (or lack of expansion) tells you EVERYTHING about what's going to happen the rest of the day
The 9:30 AM Rule:
Look at the opening 30-minute candle (9:30-10:00)
Did price expand aggressively in one direction?
Did it take out the overnight high or low?
Did it leave a fair value gap behind?
Yes to all three = the direction is set. Trade with it.
No expansion? Price just chopping around the open? Close your laptop. The day is garbage. Institutions aren't playing.
This single filter eliminates 60%+ of losing trades before they happen
Most traders lose money between 11am-3pm trying to "find setups" in a market that's already made its move
The profitable traders caught the 9:30 expansion, rode it for 30-60 minutes, hit their target, and went to the gym
The 90-minute trading day:
9:15 - Open charts, mark overnight high/low
9:30 - Watch for expansion off the open
9:45 - If expansion + sweep + gap = enter trade
10:30 - Hit target or get stopped
11:00 - Done for the day regardless
That's it. That's the whole "job."
A guy I know has been doing this for 6 years. $300k+ prop account. Works 90 minutes per day maximum.
His words: "I used to trade 8 hours. Made nothing. Now I trade 90 minutes. Make $15k/month. The extra 6 hours were literally costing me money."
The market shows you its hand every single morning
Most traders are too busy staring at 15 indicators to see it
The 9:30 window is free information. Institutions can't hide their size.
You just have to learn to read it.
Or keep trading from 9:30am to 4pm wondering why you're not profitable
Your choice…
(on 18.11 I'm going live inside the Discord and giving you my whole framework for free. the exact framework. the exact rules. the exact way I read the market. completely free. dropping the link soon and deleting it forever)
$NVDA: the WSJ reports Nvidia's board is preparing to remove Jensen Huang. Nothing is confirmed.
Has a star CEO left under pressure while the stock was running? Yes. In the four cases we found, it was personal conduct, not strategy. First trading day:
$WYNN 2018, founder, misconduct allegations (stock +110% the year before): −10.1% on the report, +8.6% the session after he resigned
$INTC 2018, past relationship with an employee (+55% the year before): −2.4%
$MCD 2019, relationship with an employee (+73% over three years): −2.7%
$HPQ 2010, harassment claim and expense findings: about −8%
Two where the CEO stayed:
$TSLA 2018: −13.9% when the SEC sued Musk, +17.3% when the settlement kept him as CEO (he gave up the chairman's seat)
OpenAI 2023 (private): the board fired Sam Altman; he was back in five days
The WSJ ties this one to two affairs, one with a suspected Chinese spy, so NVDA would be a fifth conduct case. What's new: a company this size, a founder who has run it for 33 years, and the spy question.
$NVDA after hours: about −8%. It closed 27% below its Oct 6 high, and +259% over three years.
No position.
#nvda #stocks
$FNV reported. Our door stays shut.
This morning we said we'd change our mind if ounces from interests it already held grew 10%+, with the same ounce math in both years. Condition by condition:
• Same math both years: no. FNV switched to fixed conversion ratios at its guidance prices in 2026. Q3 2025 used market prices. Under our rule, that fails the quarter on its own.
• 10%+ growth: the starting point is −6%. Total gold-equivalent ounces: 130,435 vs 138,772. Gold alone: −11%.
• Interests bought or first producing since then, stripped out: the release puts a number on only one (Casa Berardi, 1,625 oz).
Our miss: the math change meant no 2026 quarter could pass, and we didn't say so this morning. Q1 2027 is the first that could.
Since we passed: −6.4%. SPY: −0.8%.
No position.
#earnings #fnv
$FNV reports after the close today.
We passed on it Aug 22 at $265.74. Why: Q2 revenue rose 57%, but 68% of the gain was price, and about a third of the volume gain came from royalties it had bought. Its first-half adjusted earnings also included a $63.8M gain on royalty buy-backs under a changed definition.
What would change our mind, registered before this report: gold-equivalent ounces from interests it already held when the year-ago quarter began grow at least 10% year over year, rebuilt from per-asset figures in that one report. Any interest acquired or first delivering since then is stripped out, and if one can't be separated, the test fails. The ounce-conversion method must be the same in both years, as originally reported and stated in the report.
Since we passed: -3.8%. SPY: -0.9%.
No position.
#earnings #fnv
What we do now: write the test down before looking, look once, and post the misses too.
Every card we post goes up before the company reports and gets scored against its SEC filing after. Our first two bars: one hit, one miss.
#backtesting#quant
Check 6: did they compare it to just buying the index, after costs?
That TLT rule's 472% over 21 years is 8.7% a year before costs, about SPY's price gain over the same years (8.4%). With 2 bp a side in costs, it drops to about 7.6%.
@reginaldju1 We don't make price calls, so no buy or sell from us.
What we do: tomorrow's report gets scored against the two bars on the card, Q3 marketplace volume of $4.8B+ and GAAP net income above zero, and we post the result either way.
No position.
$FIGR reports before the open Thu Nov 12.
We wrote it up Aug 21 at $39.10. A day later our own re-check downgraded it: the +192% profit growth we cited leaned on a stock-comp tax benefit, a one-time gain on a sale, and a fair-value mark. Normalized, it was about +75%.
Our bars for this print:
• Q3 marketplace volume ≥ $4.8B. Figure's Oct 6 preliminary, unaudited figure was $5.12B, excluding Kiavi (acquired Sep 1). We score the reported number
• Q3 GAAP net income above zero (still open)
Kill switch (any one): marketplace volume down from the prior quarter two quarters running, GAAP losses two quarters running, or a top-3 origination partner leaving (filings don't size individual partners, so this one may never be observable).
Since our write-up: -38%. SPY: -0.6%.
No position.
#earnings #figr
@earnings_watch One note on the ±5.7%: FNV's nearest options expire Nov 20, so that straddle prices 7 trading days, not just tonight's report.
Our test is ounces, not dollars: gold-equivalent ounces from streams and royalties it already held, up 10%+. We'll post the result.
No position.
$FNV reports after the close today.
We passed on it Aug 22 at $265.74. Why: Q2 revenue rose 57%, but 68% of the gain was price, and about a third of the volume gain came from royalties it had bought. Its first-half adjusted earnings also included a $63.8M gain on royalty buy-backs under a changed definition.
What would change our mind, registered before this report: gold-equivalent ounces from interests it already held when the year-ago quarter began grow at least 10% year over year, rebuilt from per-asset figures in that one report. Any interest acquired or first delivering since then is stripped out, and if one can't be separated, the test fails. The ounce-conversion method must be the same in both years, as originally reported and stated in the report.
Since we passed: -3.8%. SPY: -0.9%.
No position.
#earnings #fnv
$TE (T1 Energy) reports before the open Thu Nov 12.
In our dossier since Aug 20: a Texas solar-module maker scaling fast. Q2: sales $250M, 935 MW produced, adjusted EBITDA +$10.7M, net loss from continuing operations $36.9M.
The risks we flagged: still losing money, one Dallas plant, and a reversal in domestic-content policy. What we missed: that adjusted EBITDA included $24.4M of tariff refunds. Without them, it was negative.
T1's own guide: Q3 and Q4 production above Q2's 935 MW pace, and 2026 production in the higher end of 3.1-4.2 GW. We'll post the result against it.
Since Aug 20: -50%. SPY: -0.1%.
No position.
#earnings #te