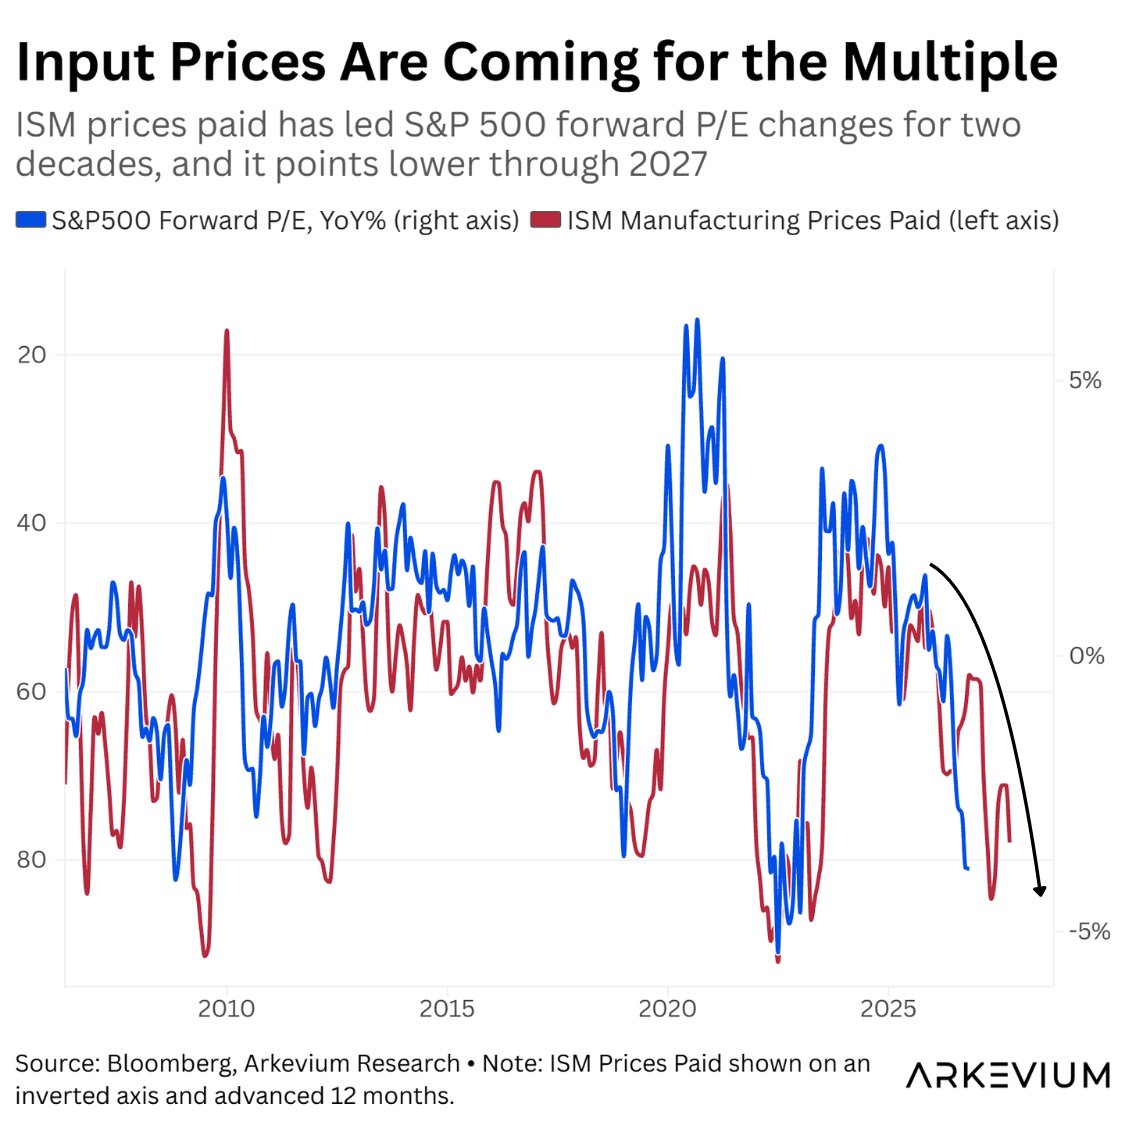
I think the S&P 500 multiple has another leg lower, and the warning sign is last week's 77.9 ISM prices paid print.
The headline manufacturing ISM came in a touch below consensus. Prices paid, however, is a different animal. At 77.9, it sits in the top 20% of every reading in the series' 75-year history.
On the chart below, I flip ISM prices paid onto an inverted axis, push it forward 12 months, and lay it against the year-on-year change in the S&P 500 forward P/E. The fit isn't perfect, but the turns line up uncomfortably well. The red line points lower through most of 2027.
Some could argue the damage is already done. The forward P/E stands at 19x, more than four turns below the 23–25x range at the start of 2026. But I still think the P/E ratio can compress from here.
Input inflation reaches valuations through three pipes, and all three are open right now:
→ The discount rate. Prices paid leads PPI, PPI leads CPI, and sticky CPI keeps the Fed on hold or worse. Nominal yields drift higher, the risk-free rate rises, and the present value of future earnings shrinks.
→ Earnings quality. A dollar of earnings flattered by inflation is worth less than one earned by selling more. Investors demand a higher earnings yield. Lower P/E, by definition.
→ Margins. The CPI-PPI spread is negative today, meaning producers are paying up faster than they can pass costs on. That condition has historically preceded margin pressure.
On the other side, forward EPS has been revised up roughly 6% over the past three months, and this years rally has been powered by earnings while the multiple contracted underneath it. Higher yields are also arriving alongside higher nominal growth, which cushions the blow. Strong earnings can absorb a lot of discount-rate pain.
So can the P/E ratio keep compressing?
Short answer: yes. If prices paid holds near these levels through the winter, the lead time points to further compression into mid-to-late 2027. How much depends entirely on the earnings offset. Back of the envelope, with forward EPS another 6% higher and the multiple sliding to 17x, the index ends up roughly 5% lower.
Equities have shrugged off higher yields and firmer inflation for most of this year. But that tolerance has a limit. Everything has a breaking point.
Earnings or multiples: which one wins in 2027?
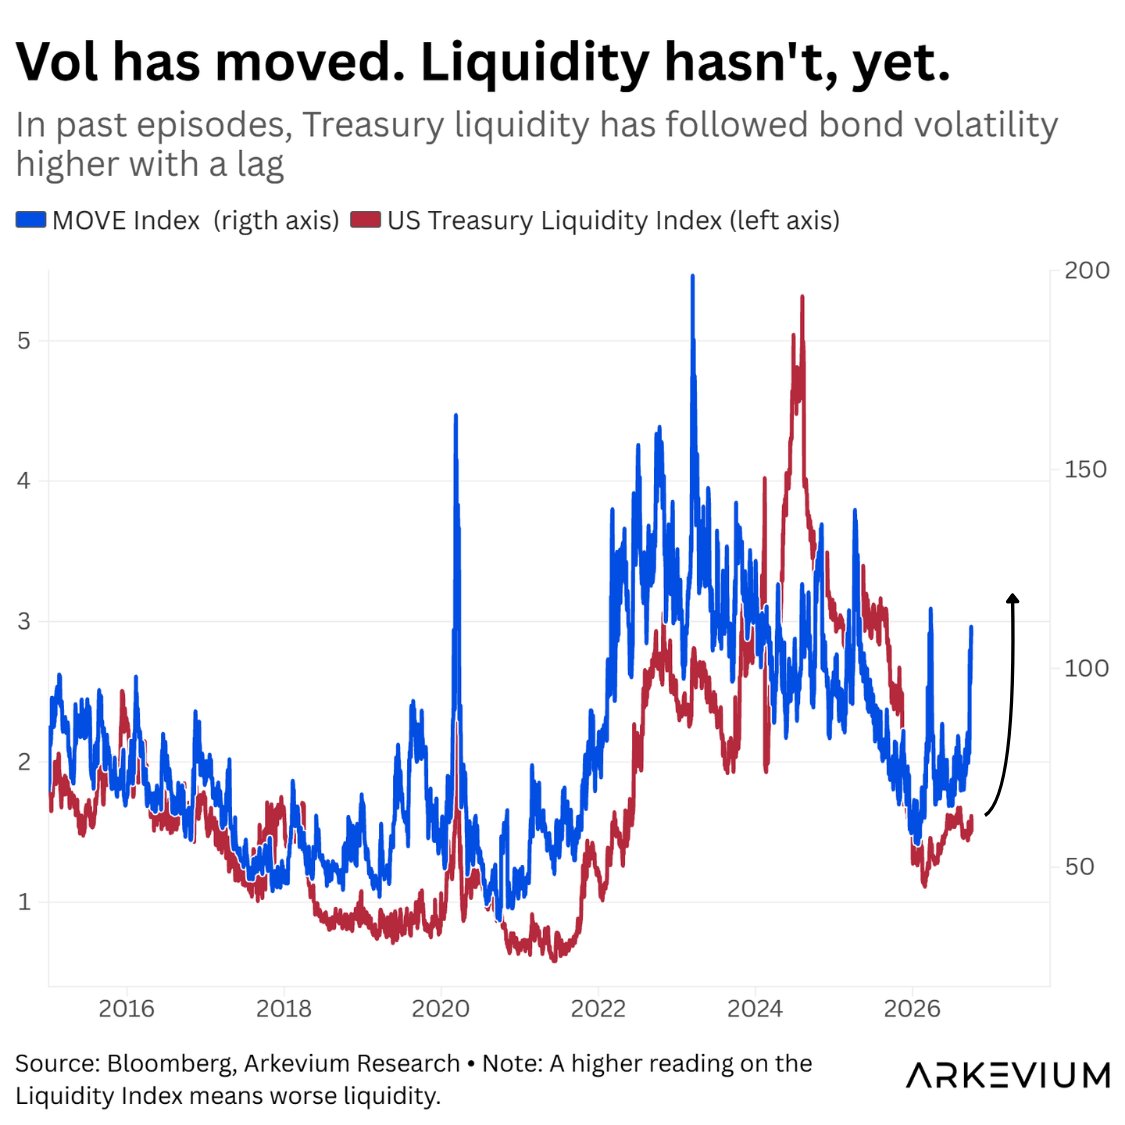
I think the Treasury market has crossed into the zone where yields stop answering to fundamentals and start answering to themselves.
With the 10-year touching 5.3%, the selloff has barely paused for breath. Below 5%, a selloff is a repricing. Above it, the plumbing matters more than the macro.
Start with the blue line. The MOVE index has ripped back to around 110, a whisker below its 2026 highs.
But the red line is the one that matters. My Treasury liquidity gauge (higher means worse) has barely twitched. It sits near 1.6, well below where it typically settles when MOVE trades above 100. I read that gap as a lag. In 2022, vol moved first and liquidity followed, then stayed impaired for two years.
The cascade I'm watching has four links in one chain:
1) Yields up → vol up. Rates have an asymmetric bound, so vol rises disproportionately.
2) Vol up → liquidity down. Higher VaR pushes dealers to step back from market-making.
3) Liquidity down → forced selling. Rising margins force leveraged holders to cut, with basis traders and risk parity first.
4) Forced selling → yields up. Selling into a thin book has outsized impact, and the loop restarts.
Then there's the slower problem. Stock-bond correlation turns positive when yields stay well above 5%, and longer-term correlations are now turning materially positive. When bonds stop hedging equities, 60/40 and risk parity lose their reason to own duration. That reallocation is slow, persistent, and very hard to stop. It removes the flight-to-quality bid exactly when the market needs it most.
So who steps in?
The Treasury, increasingly. Its enhanced buyback program is intervention in all but name, which makes Treasuries a tough short. But the first two operations failed to arrest the move, and a buyback does nothing for volatility, margin or correlation. I treat any intervention-induced bounce as a tactical event.
I see three paths from here:
1) Reflexive spiral. Oil holds above $100, breakevens push through 2.6%, MOVE breaks 130, and the 10-year runs toward 5.75–6.0%+.
2) Controlled repricing. Oil stabilizes, the Fed holds, and yields chop in a 5.0–5.5% range. Duration hurts but nothing breaks.
3) Growth shock. Data rolls over, the Fed pivots, and the flight-to-quality bid returns. Whoever bought duration at 5.25% made the trade of the cycle.
The third scenario is plausible, and it's why we wouldn't press an aggressive short on US government bonds here. Today the market is priced for the second scenario while the mechanics are flirting with the first.
Where do you think the 10-year tops out this cycle: 5.5%, 6%, or higher?