EVERYONE STOP WHAT YOURE DOING.
GO SIGN UP FOR @Tape_Vector weekly stock picking competition on @Fsl_X with @FSLCharles
Partnering with @Vance_Roberts5
Each weekly winner gets a branded shirt for winning.
I won the first one. Oh and last week so I got my shirt coming haha
Maybe I’ll let someone else win. 🥇
25/100
75 SPOTS LEFT GO SIGN UP NOW!
WHO GONNA BE THE NEXT @legendtrades45 TO WIN?
See what I did there!
Challenge me unless you’re scared.
Who’s bearish/ who’s bullish?
LOCK TF IN ITS A SHORT WEEK.
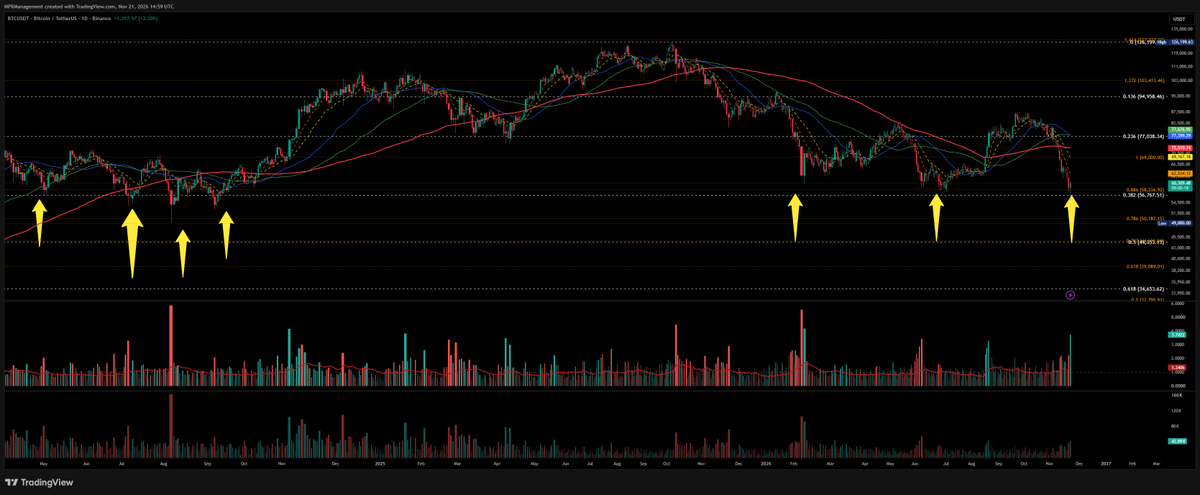
bitcoin:native November 21, 2026 The support zone I called is already getting a reaction.
Yesterday, I posted that $56,767 to $58,236 was one of the most important macro support regions on the Bitcoin chart.
Well, look where buyers decided to show up today.
Exactly around the levels I was watching.
I'll allow myself a small victory lap on this one.
But we are definitely not out of the woods yet.
What happened?
Bitcoin pushed into the support region and rejected lower prices, with significant buying participation on my 1D volume read.
That matters because this was not a random support level I drew after the bounce.
I identified this area beforehand using several technical references:
• $58,236: Logarithmic Fibonacci 0.886.
• $56,767: Logarithmic Fibonacci 0.382 from a different historical measurement.
• Around $57,800: The 6W 50 EMA.
• $56,402 to $60,994: Weekly NAV Primary Support, strength 91/100.
These structures pointed toward the same general area before price reached it.
And now we have an initial reaction.
Why am I becoming more positive?
Because we are finally seeing buyers respond where the technical structure suggested they might.
The chart also shows several earlier reactions around this broader region, which I marked with the yellow arrows.
That historical behavior was one of the reasons I considered this support important.
Today's reaction adds another piece of evidence.
But I want to make one distinction very clear.
Correctly identifying support does not mean I have correctly identified the bottom.
The weekly trend remains damaged. We still have lower highs, and several important moving averages are sitting above price.
A strong bounce can happen inside a bearish trend.
What I want to see next
First, Bitcoin needs to hold the broader $56,402 to $60,994 support shelf and establish acceptance back above $61,000.
Then I want a higher low, followed by another upside expansion.
The next important recovery references are around $63,500 and $69,000.
Beyond that, the weekly and 2W resistance structures between roughly $66,300 and $73,800 remain a major obstacle.
I would not automatically call the correction finished just because price recovers toward those levels.
And what if support fails?
If Bitcoin loses $56,402, fails to reclaim it, and starts accepting below the weekly shelf, the current bullish reaction loses credibility.
Then my next areas remain approximately $53,550, $50,187, and potentially the deeper 2W support region.
My current read
I am more constructive today than I was yesterday.
Not because the entire market suddenly became bullish.
Because price has finally provided some evidence of demand at the exact structural location I identified.
That is progress.
Of course, unexpected macroeconomic news or another major liquidity shock could change the picture quickly. But I am not building my thesis around predicting headlines.
I am watching what buyers and sellers actually do.
Final read
The first support reaction is here.
The high-volume rejection of lower prices is encouraging.
The macro bottom is still unconfirmed.
I want to see retention, a higher low, and a proper reclaim before becoming substantially more aggressive.
For now, I am cautiously positive about this support test, while respecting the bearish weekly structure.
Called the zone. Got the reaction. Now price has to prove the reversal.
My trading journal, not financial advice.
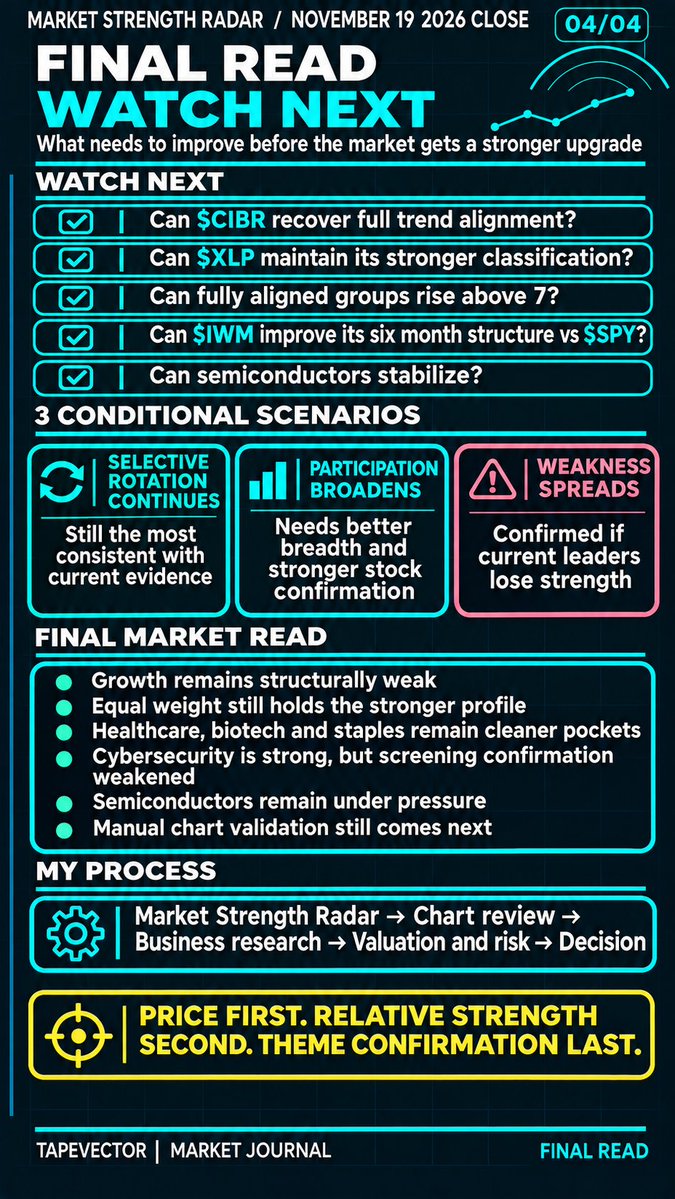
🚨 MARKET STRENGTH RADAR | NOVEMBER 20, 2026 CLOSE
📉 GROWTH WEAKNESS IS DEEPENING. EQUAL WEIGHT IS GETTING STRONGER. HEALTHCARE, BIOTECH AND CONSUMER STAPLES LEAD. SEMICONDUCTORS ARE DETERIORATING FURTHER.
The market is still showing selective rotation, not a confirmed broad recovery.
Today's update brings a mixed development.
Six month sector participation has improved, and the combined stock watchlist has expanded.
But the strongest stock screening layer has contracted again, growth underperformance has deepened, and semiconductors have suffered another substantial relative strength deterioration.
The market has leadership. It still lacks broad confirmation.
📊 THE BENCHMARK PICTURE | RS126D
🔴 $QQQ vs $SPY: -8.71%. Growth weakness is deepening.
🔴 $IWM vs SPY: -2.75%. Small caps remain structurally weaker than the broad market.
🟢 IWM vs QQQ: +5.96%. Small caps are maintaining a relative advantage over growth.
🟢 $RSP vs SPY: +8.20%. Equal weight continues outperforming cap weight, with a stronger six month advantage than yesterday.
The rotation away from concentrated growth remains visible.
But stronger equal weight performance does not mean the entire market is healthy.
🛡️ WHERE IS THE STRONGER LEADERSHIP?
Six month relative strength against SPY:
🟢 Cybersecurity $BUG: +34.86%
🟢 Cloud $WCLD: +32.37%
🟢 Healthcare $XLV: +24.54%
🟢 Biotechnology $IBB: +24.52%
🟢 Consumer staples $XLP: +14.24%
🟢 Cybersecurity $CIBR: +15.93%
Healthcare, biotechnology and consumer staples show some of the cleaner combinations of positive tactical performance, structural leadership and stronger stock confirmation.
BUG retains full trend alignment, but CIBR remains only partially aligned.
Cloud continues to show substantial six month strength, but its current tactical relative performance is negative.
Consumer staples stand out for their improving relative strength and stronger Front Line stock concentration.
📉 THE BIGGEST STRUCTURAL WARNING: SEMICONDUCTORS
🔴 $SMH: -28.72% RS126D
🔴 $SOXX: -29.47%
🔴 $XSD: -41.84%
All three have negative 21, 42, 63 and 126 day relative strength.
All three have deteriorated sharply from yesterday.
The semiconductor structure is not showing recovery. It is showing further relative weakness.
📊 MARKET BREADTH | SOME REPAIR, STILL NARROW
The radar tracks 54 overlapping sector and theme relationships.
🟢 7 fully aligned
🟡 18 partially aligned
🔴 29 unaligned
Only 20 of 54 have positive six month relative strength.
Only 19 of 54 have positive 21 day readings.
Compared with November 19:
🟡 Fully aligned: 7 → 7
🟢 Partially aligned: 16 → 18
🟢 Unaligned: 31 → 29
🟢 Positive RS126D: 18 → 20
🔴 Positive RS21D: 21 → 19
The six month participation improved.
But the strongest alignment group did not expand, and tactical breadth weakened.
That is partial repair, not a broad confirmation.
🎯 THE STOCK OPPORTUNITY SET
1,318 stocks screened.
🟢 23 Conditional Front Line
🟡 72 Developing Leadership
🔵 95 combined candidates
🔴 0 Fully Confirmed Front Line
Only 7.2% of the universe reaches the two strongest screening layers.
Yesterday there were 24 Conditional Front Line and 69 Developing names.
Today, the combined watchlist expanded, but the strongest category contracted again.
More candidates do not automatically mean better leadership.
WHERE IS STOCK LEADERSHIP CONCENTRATED?
🟡 Software $IGV: 24 Developing candidates, zero Front Line.
🟡 Cybersecurity: 12 candidates, all Developing.
🟢 Healthcare: 12 candidates, including 5 Conditional Front Line.
🟢 Consumer staples: 10 candidates, including 6 Conditional Front Line.
🟢 Biotechnology: 6 candidates, including 5 Conditional Front Line.
🟡 Cloud: 6 candidates, including 2 Conditional Front Line.
Consumer staples now have the largest identified Conditional Front Line concentration.
Software remains the largest Developing Leadership group.
Cybersecurity retains strong individual relative strength readings, but its benchmark lane still lacks full alignment.
⚠️ THE DATA WARNING
All four benchmark relationships and all 54 sector relationships match the November 20 close.
Stock coverage is 92.6% for the session.
However, the imported driver data remain older than the latest market observations.
The system contains 270 Caution candidates and 10 Driver Headwind reviews.
Those driver classifications require updated evidence before they can be treated as current.
🔎 WHAT MATTERS NEXT?
Can growth stop losing ground against the broad market?
Can small caps convert tactical strength into positive six month relative performance?
Can consumer staples maintain their stronger leadership?
Will the 7 fully aligned groups expand?
Can cybersecurity recover complete confirmation?
Can software convert its 24 Developing candidates into a stronger screening layer?
Will semiconductors stabilize after another substantial deterioration?
📌 MY CURRENT READ
Healthcare, biotechnology and consumer staples remain among the cleaner leadership pockets.
Cybersecurity has strong structural performance, but its stock screening confirmation remains incomplete.
Cloud is structurally strong but tactically weak.
Equal weight is outperforming.
Growth and semiconductors remain under pressure.
The stronger stock watchlist is expanding slowly, but the highest quality screening layer continues to contract.
This is selective rotation, not a broad buying environment.
The Market Strength Radar tells me where to look first.
Manual chart validation still comes next.
My market journal, not financial advice.
Happy Saturday everyone! ☀️
Friendly reminder that you don’t have to attend every
argument you’re invited to.
Grab some water, step away from the stress, and
enjoy your day.
How are we spending the weekend?
My wife still remembers the exact restaurant we went to on our second date.
I forgot it existed.
She also remembers what I was wearing the day we first fought.
I don’t even remember the fight.
I’ve noticed something over the years:
She remembers the small things.
I remember almost nothing.
What’s one thing your partner always remembers that you always forget?
GM EVERYONE ☀️
@WeexCn 做合约,来 WEEX。一个账户,交易 Crypto、美股、黄金与全球市场
Sunday is a good day to thank yourself for every time you chose to keep going.
That quiet grit is building something bigger than you can see yet.
A fresh week here, and you're ready for it 🥂
📈 THE THEME IS DOING ITS JOB. THE STOCK STILL NEEDS TO PROVE IT CAN PARTICIPATE.
This is the main issue in the current Future Leader Radar.
Some supporting themes are already outperforming.
But the stocks inside them are not showing the same consistency.
The current focused list makes this clear.
🟢 16 of 30 have fully aligned supporting theme evidence.
🔴 None of the 30 has fully aligned stock RS confirmation.
That is the central gap.
🔎 EXAMPLE 1: HEALTH CARE
XLV is showing strong relative performance.
🟢 +24.54% over 126 sessions.
🟢 +7.95% over 21 sessions.
The supporting sector evidence is constructive across multiple windows.
But $AHCO remains materially behind.
🔴 -54.0% stock RS.
Repairing price structure.
The sector is outperforming, while the individual company has not established reliable relative strength.
That could eventually become a recovery opportunity.
But there is another possibility.
The market may be discounting company specific risks that the sector trend cannot resolve.
I need business evidence before treating the underperformance as temporary.
🔎 EXAMPLE 2: CONSUMER STAPLES
XLP also has strong supporting relative performance.
🟢 +14.24% over 126 sessions.
🟢 +10.73% over 21 sessions.
But $PEP remains behind.
🔴 -13.4% stock RS.
Repairing price structure with a pullback.
The sector is giving constructive evidence.
The stock is still not participating consistently.
This is why I do not buy a lagging company simply because its sector is strong.
Relative weakness can persist even when the surrounding market improves.
🔎 EXAMPLE 3: SOFTWARE
The software benchmark tells a different story.
IGV has +5.25% RS over 126 sessions, but -6.86% over the latest 21 sessions.
Medium term performance remains positive.
Recent momentum is weakening.
$PAR has +35.3% numeric stock RS, but its trend evidence remains mixed and its price structure is still repairing.
A positive RS reading does not establish a completed recovery.
Here I need both stock level improvement and stabilization in the wider software theme.
The stock RS readings and sector window returns are different measurements. They should not be subtracted as if they were identical holding period returns.
💭 MY OPINION:
These are three different problems.
AHCO has substantial relative weakness despite a strong health care backdrop.
PEP is lagging an outperforming consumer staples sector.
PAR has a positive relative performance reading but still lacks consistent trend confirmation.
I would not use the same trade plan for all three.
A strong sector is useful evidence.
It is not proof that an individual stock is mispriced or ready to recover.
That is the difference between theme leadership and confirmed stock leadership.
My market journal, not financial advice.
@QualCompounders@grok My three would be $TSM, $META, and $IREN. TSM for its strong AI chip demand, META for its advertising business, and IREN as the higher-risk, higher-upside recovery play.
Well, WEEK 3 of the $1K to $1M Trading Challenge is in the books, and something rather unexpected has happened.
MY ACCOUNT ACTUALLY MADE MONEY THIS WEEK! 😂
Yes, you read that correctly.
After two weeks of experimenting with options and doing a pretty impressive job of destroying my virtual capital, I finally managed to finish a week with a positive realized P&L!
Now, before we start celebrating, let me remind everyone where this magnificent journey began.
On November 1, I joined @Twills08 challenge with a $1,000 IBKR paper trading account.
The objective?
Turn $1,000 into $1,000,000.
Sounds simple enough, right?
Well, apparently nobody told my trading account which direction it was supposed to go! 😂
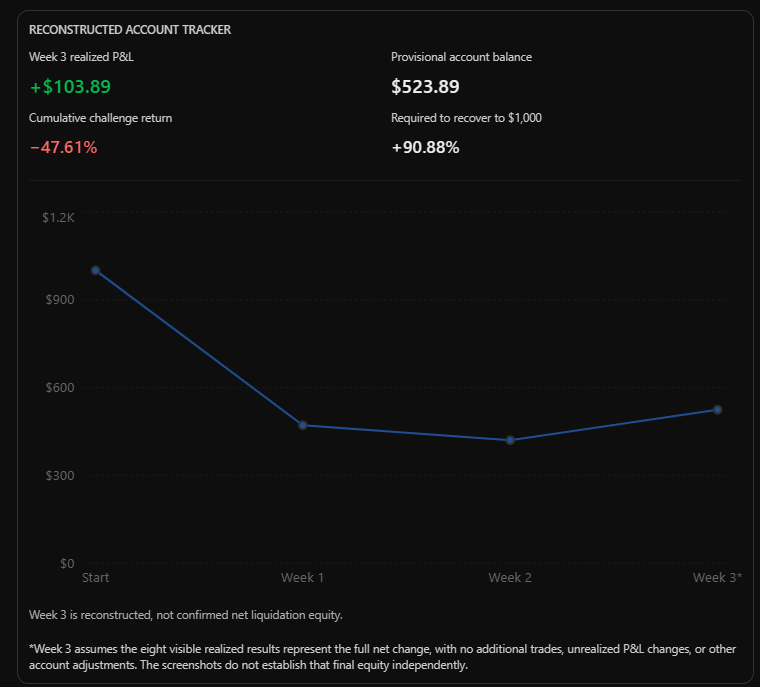
LET'S LOOK AT THE FIRST THREE WEEKS.
Starting balance: $1,000
Week 1: $471 | -52.90%
Week 2: $420 | -10.83% for the week
Week 3: +$103.89 in realized trades!
Based on this week's reported trades, that gives me a calculated running balance of approximately $523.89, subject to the final account equity reconciliation.
So where does that leave me?
Still down approximately 47.61% from the original $1,000!
Yes, I finally managed to make money, and I'm STILL almost halfway to zero! 😂
The good news is that I've recovered some of the losses.
The bad news is that I now need approximately +90.9% just to get back to my original starting balance.
And to reach the million?
Only another 1,909 times my calculated remaining capital!
Perfectly reasonable objective, don't you think? 😂
NOW, WHAT HAPPENED THIS WEEK?
I've continued learning options, trying different setups, expiration dates, strikes and ways of managing trades.
And I actually managed to close several profitable positions.
Here are the individual realized results from the trades I'm sharing.
THE WINNERS
$CRWV call: +$53.19
$SPY 700 put: +$33.16
SPY 733 call: +$32.12
$SMCI call: +$24.93
SPY 731 call: +$15.58
SPY 700 call: +$10.64
Total winning trades: +$169.62
Not bad!
For a moment there, I almost started believing I knew what I was doing.
But of course, the market had a few things to say about that! 😂
THE LOSERS
SPY 731 call: -$61.06
SPY 721 put: -$4.67
Total losing trades: -$65.73
And after putting the individual results together:
NET REALIZED P&L: +$103.89
There it is!
My first genuinely encouraging week in this challenge.
But I want to point out something important.
My biggest losing trade was larger than my biggest winning trade.
That single SPY call loss wiped out a considerable part of what I had earned from the other positions.
And that's exactly the kind of thing I need to work on.
Because being right about market direction isn't enough when trading options.
You also have to be right about timing, choose an appropriate strike and expiration, understand what implied volatility is doing, and manage the position before time decay or a reversal starts eating the premium.
I'm discovering that getting an options trade into profit and actually keeping that profit are two very different skills.
And sometimes I manage to demonstrate that difference rather spectacularly! 😂
WHAT HAVE I LEARNED SO FAR?
Week 1 was my introduction to how quickly things can go wrong.
My $PLTR calendar spread experiment was a disaster. I closed the short calls too early, kept the long calls, and watched almost all their value disappear.
That was a lesson in managing multi-leg options positions.
Week 2 wasn't much better for the overall account, although I was starting to get more comfortable with the mechanics.
And now Week 3 has finally produced some positive results.
Does that mean I've figured out options trading?
Absolutely NOT!
Three weeks of paper trading, with two terrible weeks and one profitable week, don't establish a profitable strategy.
But I am starting to understand the mechanics better, and I'm becoming more aware of where my mistakes are happening.
That's progress, even if my account balance hasn't quite received the message yet!
NOW, I'M MAKING ANOTHER CHANGE.
I'm moving my paper trading account from IBKR to TradingView.
Why?
Because the IBKR demo environment I've been using is becoming too restrictive for what I want to test.
I want to experiment with more instruments and trading approaches, including futures, simulated leverage and smaller stocks.
But in my current IBKR setup, I don't have the access or flexibility I want.
And one particularly annoying problem has been delayed market data on penny stocks.
Trying to trade volatile small caps without reliable current quotes isn't exactly the kind of realistic practice I'm looking for.
So I'm moving to TradingView Paper Trading.
There I can test simulated futures, configure leverage for separate experiments, and manage trades directly alongside my charts and indicators.
Of course, I'll still need to check the data subscriptions and instrument availability.
And because @Twills08's challenge has a no-margin rule, any experiments involving leverage or futures that aren't permitted by the competition will be kept separate from my official challenge results.
I'm changing the trading platform, not quietly changing the rules!
AND NO, I'M NOT RESETTING THE ACCOUNT!
That would be a little too convenient, wouldn't it? 😂
Imagine losing almost half your capital, changing platforms, and suddenly announcing that you're back to $1,000.
Nice try, Paul!
The challenge continues with the remaining account equity, not with a fresh balance.
I'll carry the reconciled amount over to TradingView and continue from there.
Same starting point.
Same accumulated losses.
Same ridiculous million dollar objective.
Just a different platform and, hopefully, a slightly less confused trader operating it!
MY PLAN FOR WEEK 4
I want to keep learning, but I also want to become more disciplined about the risks I'm taking.
A few profitable trades are encouraging, but they don't erase the damage from the first two weeks.
I need to focus more on the quality of the setup, how much I can lose if I'm wrong, and how I manage the position after entering.
I also want to separate testing a new strategy from desperately trying to recover losses.
Because that second approach is a very efficient way to destroy what's left of the account.
Trust me, I've already conducted some rather convincing experiments in that department! 😂
A big thank you again to @Twills08 for organizing the $1K → $1M challenge.
And congratulations to everyone who's managing to grow their accounts.
As for me, I'm still a considerable distance away from the million.
Actually, I'm still a considerable distance away from my original thousand! 😂
But I'm continuing to learn, and I'll keep sharing the good trades, the bad trades, and the ones that make me question whether I should be allowed anywhere near an options chain.
WEEK 3 FINAL READ
+$103.89 realized from the trades reported.
Calculated running account: approximately $523.89, pending final equity confirmation.
Still down about 47.61% overall.
And still very much in the game!
The objective for next week?
Let's try to finish green AGAIN.
Preferably without giving the market another opportunity to teach me a $500 lesson in virtual dollars!
See you in Week 4!
My trading journal, not financial advice.