10 years trading with TD Sequential.
Here’s what I’ve learned that most traders never talk about.
TD Sequential helped me pay off all my debt and reach financial freedom in just 6 months.
- No complicated analysis.
- No leverage.
- Spot only.
The goal?
- Shorter HOLD time.
- Better entries.
- Less noise.
Most people only talk about 9 → 13 → wait for a buy/sell.
But I see TD Sequential differently.
And here’s Rule #1:
TD Sequential is momentum.
It reflects the internal pressure of the move.
So don’t just look for the 9 or 13.
Look at the 6.
Look at $FLOCK, $ARX, solana:DvjbEsdca43oQcw2h3HW1CT7N3x5vRcr3QrvTUHnXvgV in the chart.
Do you see it?
Before that #6 appears, there’s already a strong downside wave.
Then the #6 starts forming.
That’s the part most traders completely ignore.
A #6 appearing after a meaningful price decline is NOT the same as a random #6.
Context matters.
The wave matters.
The momentum behind the numbers matters.
Once you learn to read that structure, the #6 can become a much more interesting early signal — long before everyone starts waiting for 9 → 13.
This is just Rule #1.
If you’re wondering why this particular #6 matters so much, comment below.
I’ll explain it publicly.
@RickCee1968@Mr_T____1776@BonkDaCarnivore@profstonge Could think of this:
The Domestic product of the US economy needs foreign stuff to produce its products. This stuff is more expensive. The cost to produce the domestic product increases. So does the sale price of said Domestic product. Makes sense?
@TraderMagus Could you share ur list of strong ones?
Or should we take a sneak peak at your tradingview category "good ponzy" during your next video? 🤗
If you're serious about learning TA and building your own trading skillset, make it a habit to monitor the following charts — primarily on the 1W (weekly) and 1M (monthly) timeframes.
• Use 1M to confirm your overall bias.
• Use 1W to plan your entries and exits more precisely.
Here are the key charts you should focus on:
• $USDT.D – This chart gives you clarity on market sentiment and often indicates $BTC direction.
• #TOTAL – Represents the entire crypto market cap. Helps gauge broader market strength.
• #TOTAL2 – Excludes BTC. Focuses on $ETH and the general altcoin market.
• #TOTAL3 – Excludes BTC and ETH. Useful to analyze low-cap altcoin trends.
• #DeFi – Tracks the DeFi sector. Crucial for on-chain strength analysis.
• #OTHERS.D – Reflects dominance of non-top coins. Useful for altcoin cycles and rotation insight.
The most important charts are:
🔹 $USDT.D
🔹 #TOTAL
🔹 #TOTAL2
Once you have a strong read on TOTAL2, charts like TOTAL3, DeFi, and OTHERS.D become optional — mainly for extra confluence when building your trading plan.
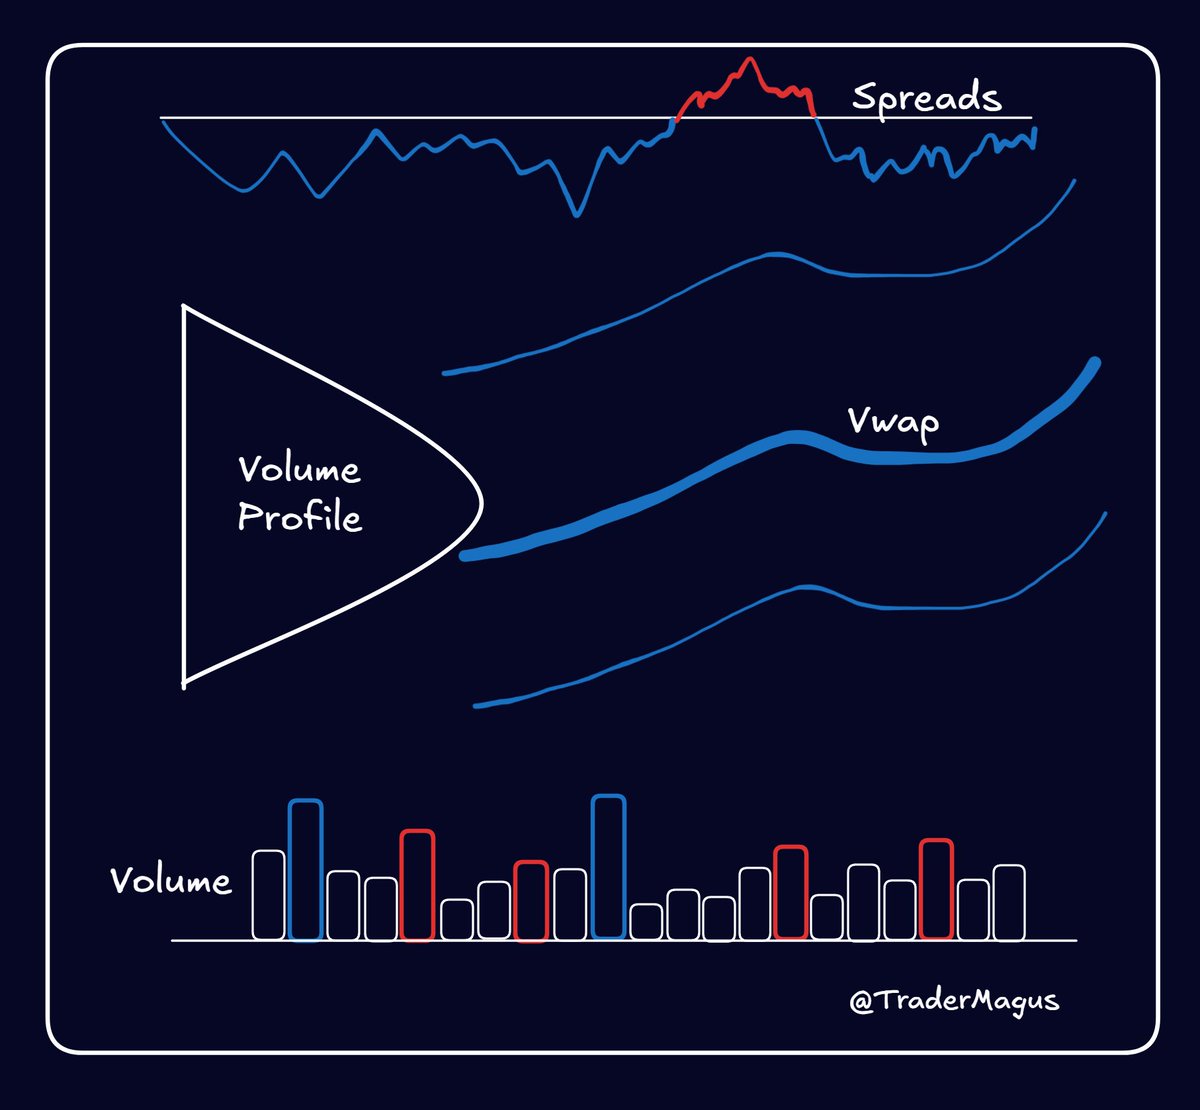
Tradingview Orderflow Guide
For years our options for flow on TV were pretty weak but things have come a long way now
Lets cover a few useful flow tools
These are the essentials
Volume Profile & Vwap: These tell me how to bet and where
Volume: Tells me who's in control & when momentum is shifting
Spreads: Tell me who's buying and who's selling
Here's my template I use everyday
1. Volume - The bedrock of flow
Relative Volume(Rvol) - Good intro tool for the noobs
Delta - Has its use-cases but still needs standard volume in confluence
Buy/Sell - My personal fav, gives most detail
CVD - TV version is terrible don't use
2. Volume Profile - The OG flow tool
Time - Daily, Weekly etc; Called "PVP" on tradingview
Fixed Range - Manually drawn profiles for ranges
Visible Range - Profile for visible price data on screen
3. Vwap - My "I cant live without tool"
Time - Daily, Weekly etc; Default vwap
Rolling - Vwap without set start time(smoother version of vwap)
Anchored - Vwap with controlled starting point; Nuanced version
4. Open Interest - How to see when others are making mistakes
5. Spreads - Comparing price of different BTC markets. On ltf can give context clues as to who's buy/selling and who's in control
How to get these indicators for yourself?
Easy.
Go to the indicator search bar and type the names in. Most of these are default now adays
How do you use them?
Go through my threads and Youtube, don't be lazy
Press like I've got big things in the works for you
Volume Profile Types
Here’s something I’ve put together for the charity mentorship I've been running.
Personally, I primarily use Fixed Range Volume Profiles (FRVP) and Session Volume Profiles (SVP), and occasionally incorporate Point of Control (POC) profiles with Delta visualization.
Tooling on tradingview has improved vastly over the last few years.