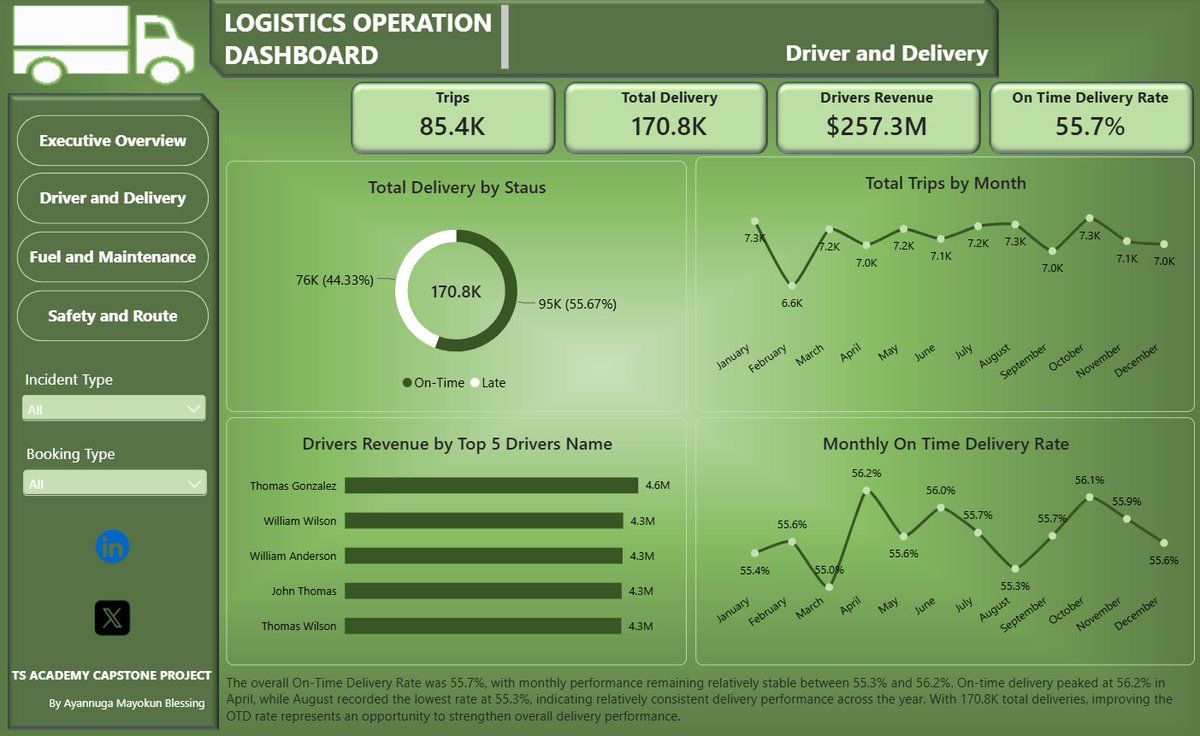
I’m excited to share one of the projects I completed as part of my TS Academy Data Analytics training — a Logistics Operations Dashboard built with Power BI.
Thank you to TS Academy @TechSphereAcad and our tutor @ezekiel_aleke.
I just confirmed the reason why I look like a malnourished human being is because I am a very lazy person 😭😭😭
Hunger want to destroy me right now but instead of me to stand up and cook, I’d rather continue watching my crime docs,tweet about it and possibly drink garri
😭😭😭😭😭😭😭😭
Hello November 📊
New month to clean more data, build better dashboards, and turn insights into impact.
October taught, November will reward.
Happy New Month, Data Fam! 🚀
#DataAnalytics#HappyNewMonth#November2026
Most dashboards show what happened. The best reveal why it happened and what to do next. 📊
I engineered a 3D Flip-Card KPI visual in Power BI using DAX, HTML, CSS & SVG—turning 1,505 renewable energy records into actionable insights.
Beyond dashboards. Into decision
Finalized the Moniepoint dashboard project. The single-page view had limitations in answering key business questions, so I expanded it to three dashboards for deeper insights.
Good morning
The wait is finally over! It's time to reveal my secret project. 😊
First, all thanks to God for giving me the strength to push through and complete it.
I won't lie to you,it wasn't easy,
but we kept pushing
https://t.co/a5a5wUQFpk
Remember: Wake up and stay up!
I’m excited to share one of the projects I completed as part of my TS Academy Data Analytics training — a Logistics Operations Dashboard built with Power BI.
Thank you to TS Academy @TechSphereAcad and our tutor @ezekiel_aleke.