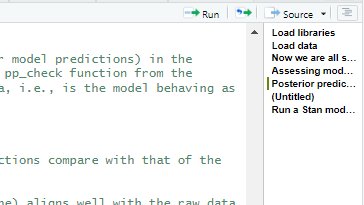
For the first time I realized R has a document outline feature where you can make your sections into an outline and jump right on to the relevant one without scrolling 🤯#rstats#phdchat#phdlife
Additional maps and plots are on my tracking site - https://t.co/hLtVxFPKNo.
My #rstats code and and data are all available on @GitHub - https://t.co/I7RtouVlx9. They're licensed for re-use with attribution, and feedback and improvements are always welcome. 16/16
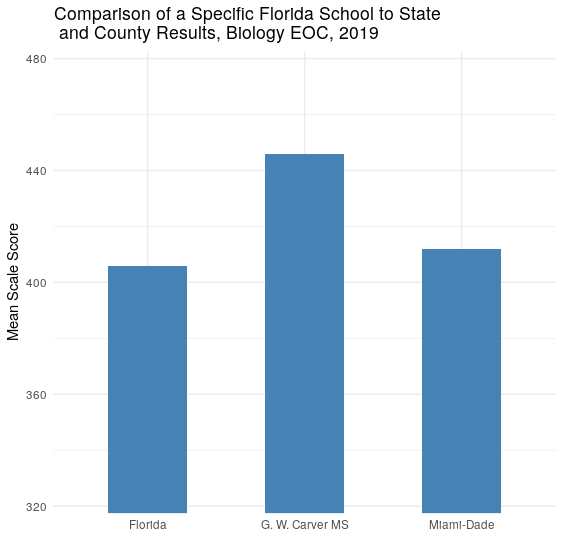
@sosa_reyes1@MsJAMartinez#rstats Dr. Sosa, Ms. Martinez. The same kind of data analysis I performed for Algebra 1 EOC, 2019 I performed for Biology, 2019. The scale is from 325 - 475. If you wish I can perform a similar analysis for any school in the state.
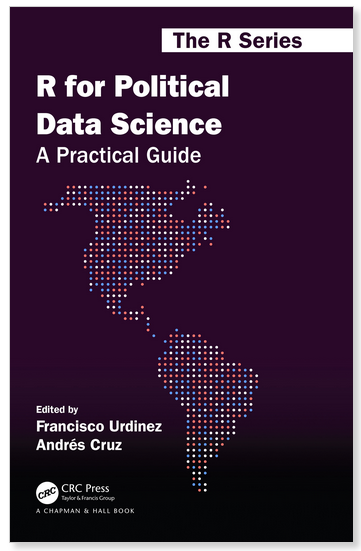
También estamos trabajando en una versión en inglés del libro, editada por @CRCPress@RobCalver5 como parte del #RSeries. En unas semanas les contamos más, aquí la tapa: #RStats
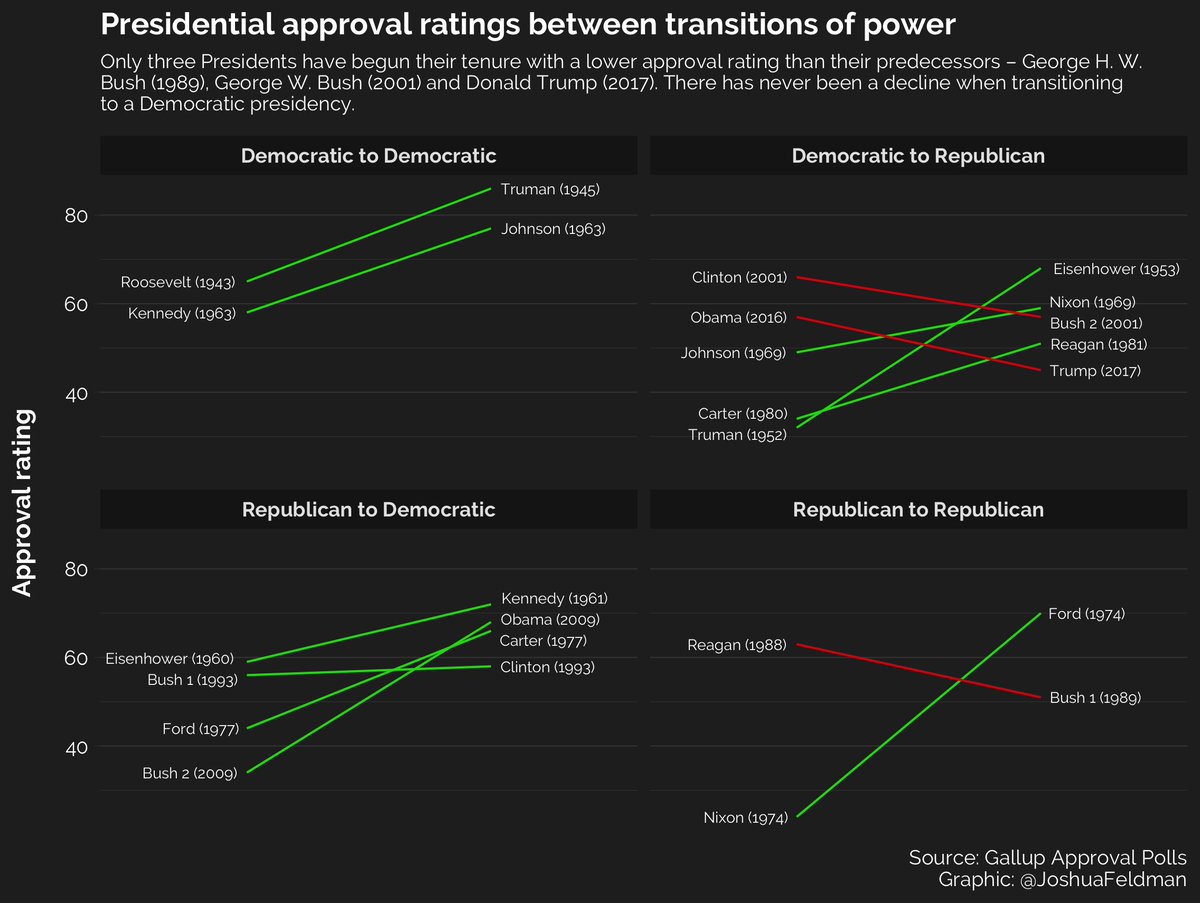
Presidential approval ratings between transitions of power.
There has never been a decline when transitioning to a Democratic presidency.
Code 👨💻: https://t.co/vdCSHpEeCC
Graphic 📈: https://t.co/AqWfqJArlt
#rstats#ggplot2#dataviz
Please help me copy my R code here; Do i have to replace double quotes with single? and what about errors as one line extends to the next? #tidyverse#rstats https://t.co/XR0Rekp20t
ggplot2: creating a linear map (of transcription factor binding sites) consist with a line and filled boxes by using geom_segment and geom_text_repel #tidyverse#rstats https://t.co/X6Gcur8q9h
#GIS and #rstats friends. Do you have a favorite package for supervised classification of rasters for landcover? Have tried superClass but haven't been able to get it to work- any other suggestions?