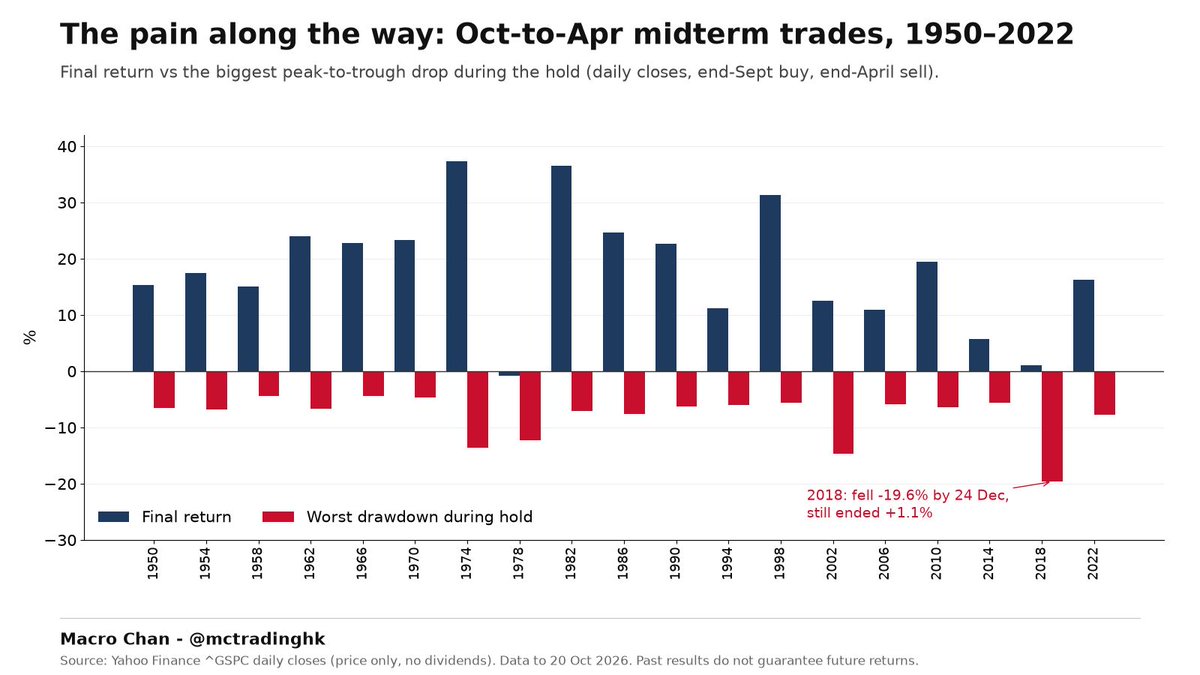
1/7 US midterms are 12 days away (Nov 3). A popular online claim says stocks "always" rise after a midterm. We tested S&P 500 from end-Sep to end-Apr: since 1950, midterm years were up 18 of 19 times, avg +18.3%. Other years: up 70% of the time, avg +4.5%.
Takeaway: European bond stress is back near 2011 levels, but history gives no fixed playbook for EURUSD, Treasuries or BTC afterwards. "Spread widens = euro falls" isn't supported by the data. Not a buy/sell call.
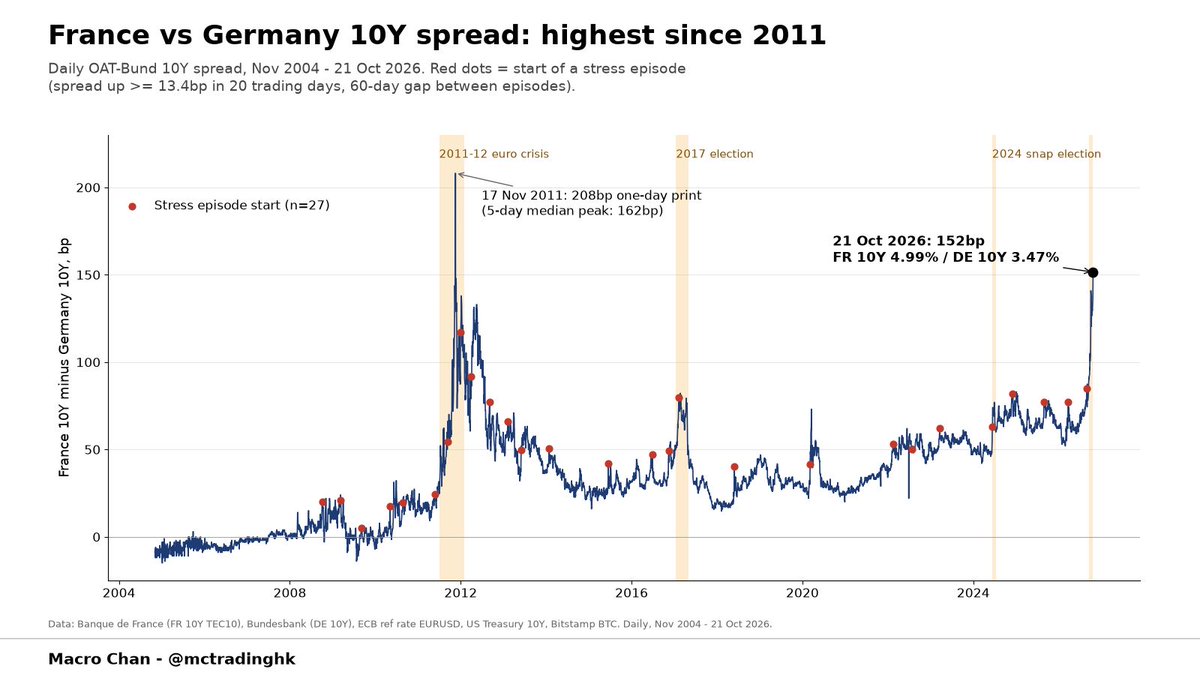
France's 10Y closed at 4.985% on Oct 21 (briefly above 5% intraday), the highest close since daily data starts in 2004. The OAT-Bund spread hit 152bp, up 56bp in 20 trading days. Last close above 150bp: Nov 2011, the euro crisis.
Smooth out one-day data glitches and EURUSD flips to +0.5%, US 10Y to +0.5bp. The sample also includes non-French shocks like 2008 and 2020. What did hold up: the spread itself usually stopped widening soon after the signal.
Mix them up and the backtest still looks fine. Live trading does not.
Ep0, the map plus a six-gate build pipeline:
https://t.co/LObxEEwUMT
Next: three popular trend rules run exactly as published, then funding carry.
Method and data only. NFA.
Most people start a quant strategy by writing code or hunting for a pretty equity curve.
The first step is neither. First get clear which kind of alpha you are actually hunting.
I put the map in a new English series on Substack. Quick version below.
Five common kinds of alpha:
1. Time-series (CTA): trend or mean reversion
2. Cross-sectional: long one basket, short another
3. Carry: collect funding, compare it with the T-bill
4. Event-driven: listings often priced in within minutes
5. Stats arb: high bar for most retail
7/7 Since 1950, holding only in midterm windows and T-bills otherwise: +32,527% vs buy and hold +39,553%, invested ~15% of the time. Price only; with dividends buy and hold wins by ~3pp a year. A strong tendency, not a sure thing. NFA.
1/7 US midterms are 12 days away (Nov 3). A popular online claim says stocks "always" rise after a midterm. We tested S&P 500 from end-Sep to end-Apr: since 1950, midterm years were up 18 of 19 times, avg +18.3%. Other years: up 70% of the time, avg +4.5%.