Footwear accounts for more than twice the Nike brand revenue as apparel and men’s products more than women’s and kids combined: https://t.co/3U47L4j3uL
Plastics are the most common aquatic litter material across all environments. The most common litter source was take-out items like plastic bags and food wrappers, as shown in these horizontal 100% stacked bar charts: https://t.co/2OY0Ltk1Tw
Renewable capacity additions in 2020 expanded by more than 45% from 2019, with growth in both wind and solar. China accounted for 72GW of the 86GW of incremental added capacity, as shown in these waterfall charts: https://t.co/IAA1GmgOwu
The number of social media users worldwide has grown 61% from 2016-2020, while average time spent per user per day has grown only 13%: https://t.co/aBR3DKu50c
Most of the 3+ billion internet unconnected are in Asia and Africa. Regional adoption rates vary widely from 71% in Eastern Asia to 24% in Eastern Africa, as shown in this 100% stacked bar chart with data column: https://t.co/YmvUsPBQWF
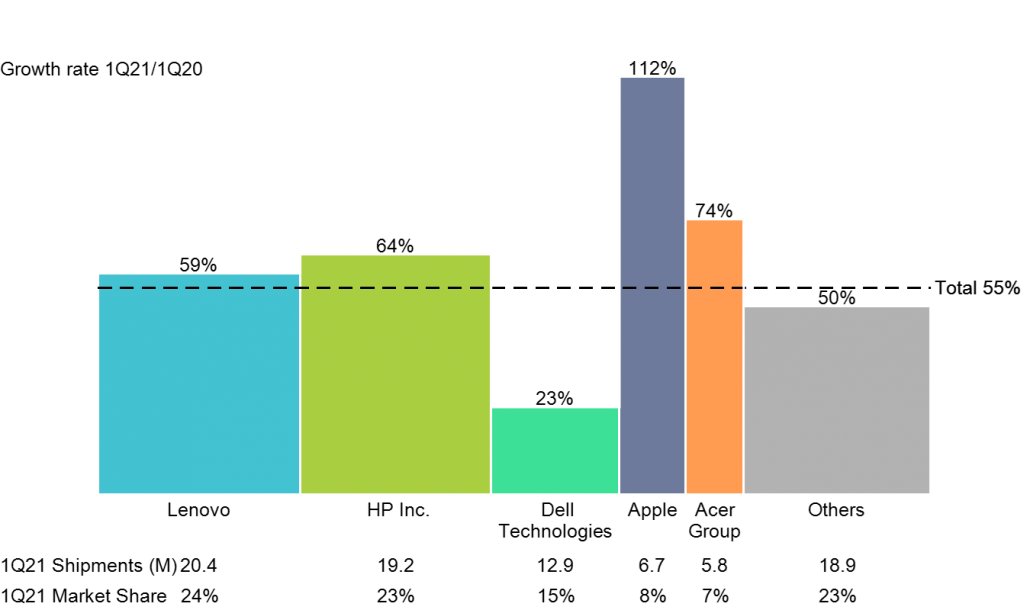
PC shipments grew 55% year over year during the first quarter of 2021. Apple and Acer had the highest growth rates, while Dell lagged its major competitors, as shown in this bar-mekko chart: https://t.co/vhrjxXhQx1
Southeast, Far West and Mideast each account for about 20% of US GDP. California, Texas, New York and Florida are the biggest contributors, as shown in this Marimekko chart: https://t.co/1d1rm9Wf28
Netflix, Amazon Prime Video and Spotify have the most subscribers among the streaming services. Video services are more popular than audio, as shown in this horizontal bar chart with data column: https://t.co/AuHeGWXfIP
Over the last decade, U.S. adults increased their time spent on mobile devices by 460%, from 45 to 252 minutes per day. Time spent on radio, television and magazines all declined: https://t.co/IwNKAalV2G
After 5 years of decline, the pandemic spurred a 14% increase in tablet shipments in 2020. Samsung and Lenovo benefited most, growing 44 and 64% respectively: https://t.co/7GUE40rLfI
Amazon market share leads the $909B ecommerce market at 40% and it is also among the top 3 in digital advertising, online grocery and cloud computing, as shown in this Marimekko chart: https://t.co/o6dpxudmOc
Branch banking in the US has been in a decline over the last decade, as shown in this stacked bar chart with net line. In every year between 2010 and 2020, there were more bank branch closings than openings. Check out the post: https://t.co/7jWgMEOl7U
“Apple and Huawei increased their combined share of the smartwatch market from 34% to 41% between 2019 and 2020. The overall market grew just 1.5%, as shown in this 100% stacked bar chart: https://t.co/fbG14puK51
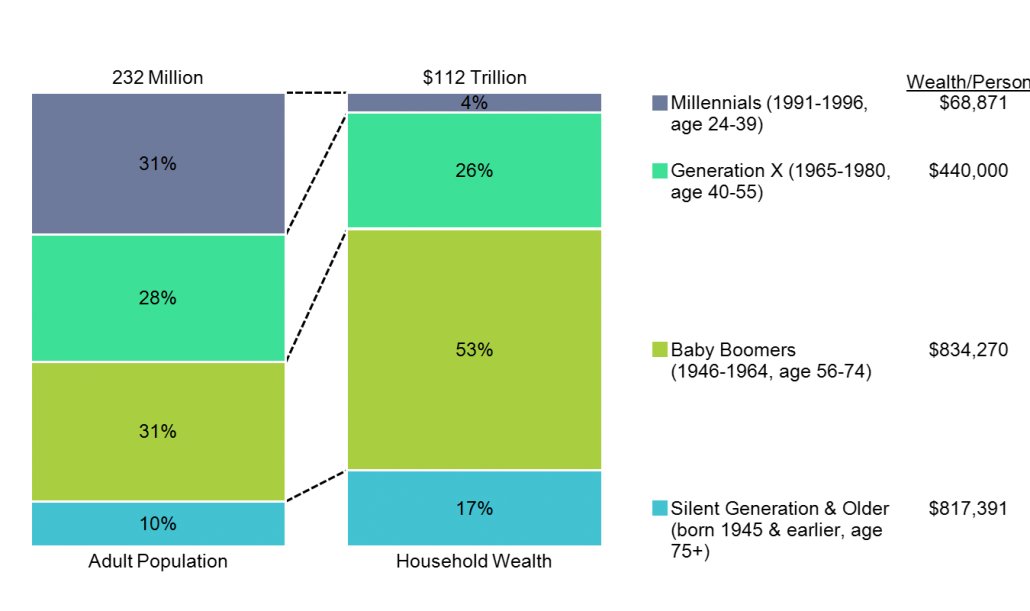
Older Americans hold a disproportionate share of US household wealth. The 41% of Americans over 55 account for 70% of the household wealth, as shown in this 100% stacked bar chart: https://t.co/gHxMEijiox
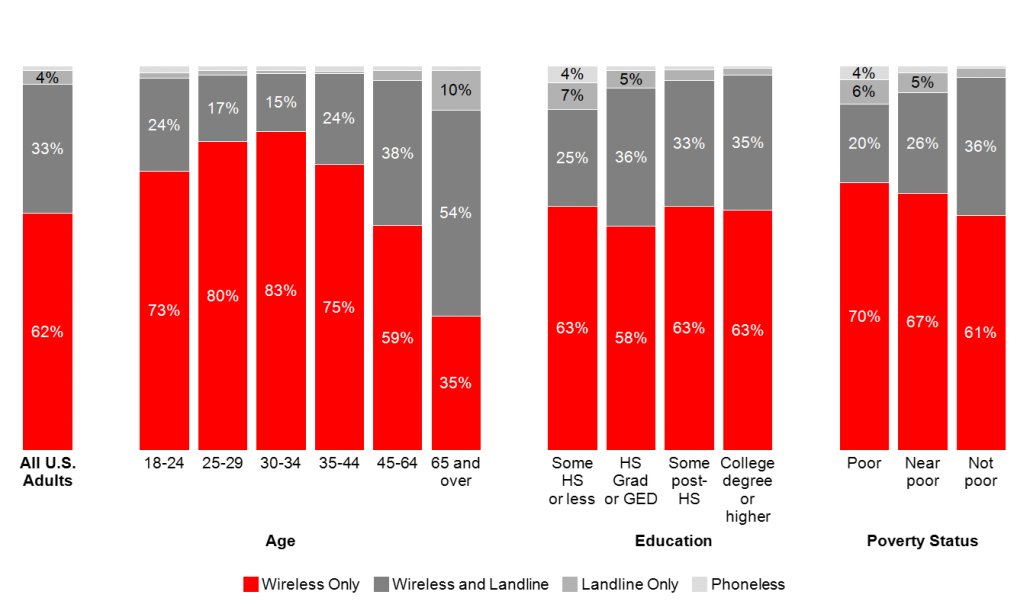
Most American adults rely solely on wireless phones. The principal exception are those 65 and older, as shown in this 100% stacked bar chart. Check out the post: https://t.co/Tvrw27YqGW
Mobile 5G subscriptions are projected to grow 59% annually over the next 6 years, increasing from .2B in 2020 to 3.5B in 2026, as shown in this stacked bar chart: https://t.co/LLxZjkTr5N
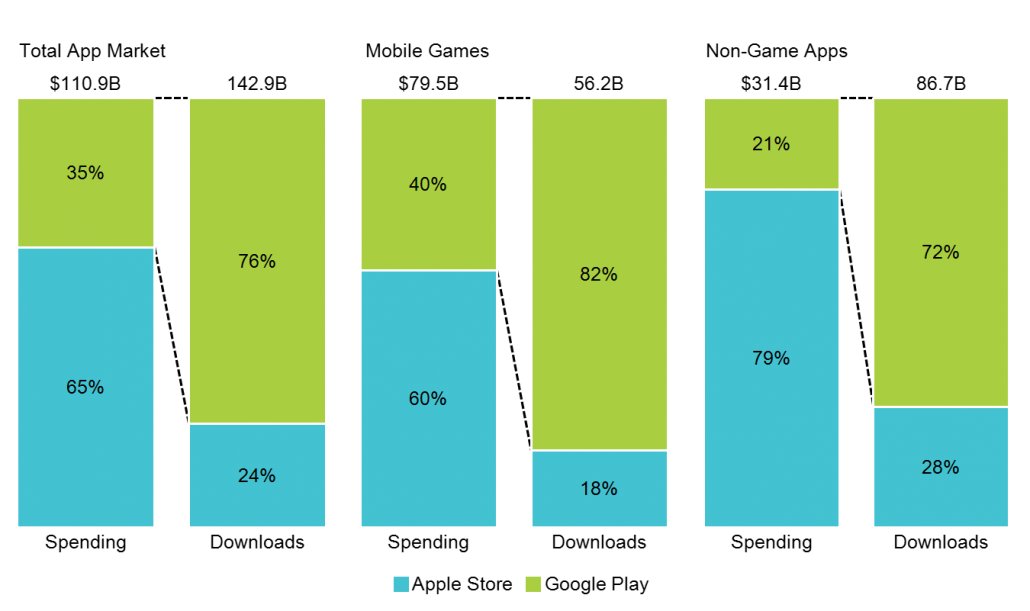
When compared to Google Play, Apple Store accounted for 65% of app spending, but only 24% of downloads, as shown in these three 100% stacked bar charts. Check out the post to learn how to create or download the chart: https://t.co/LGGqH53Uoy
Tesla’s market capitalization is over 3 times Toyota’s, even though it produces far fewer cars, as shown in this horizontal bar chart. Check out the post to learn how to create or download the chart: https://t.co/Y3mA5Twufb
Driverless car testing accounted for almost 2M miles in California in 2020, as shown in this stacked bar chart. Check out the post to learn how to create or download the chart: https://t.co/sNA18K9Kst