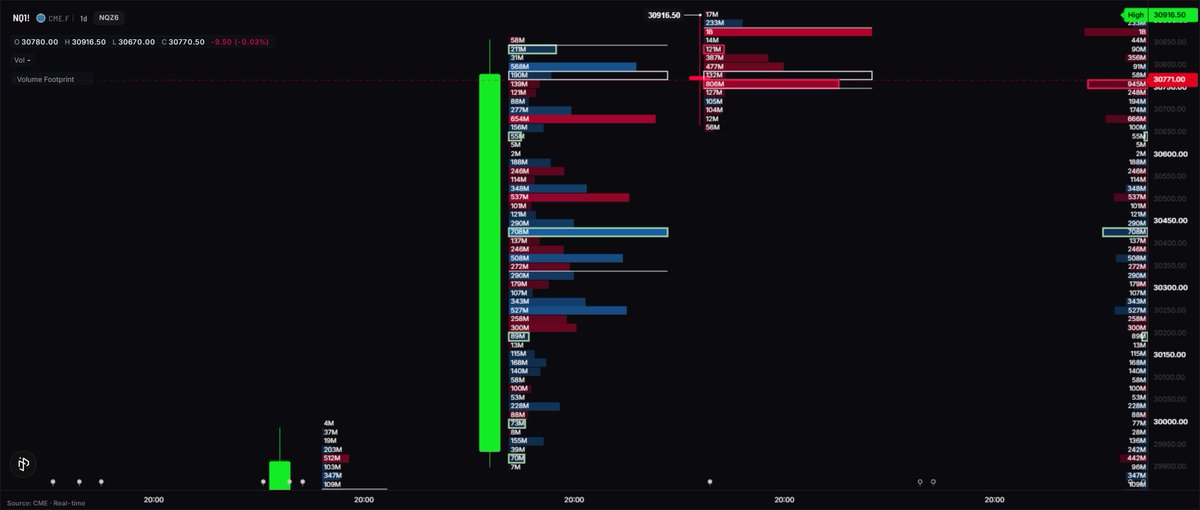
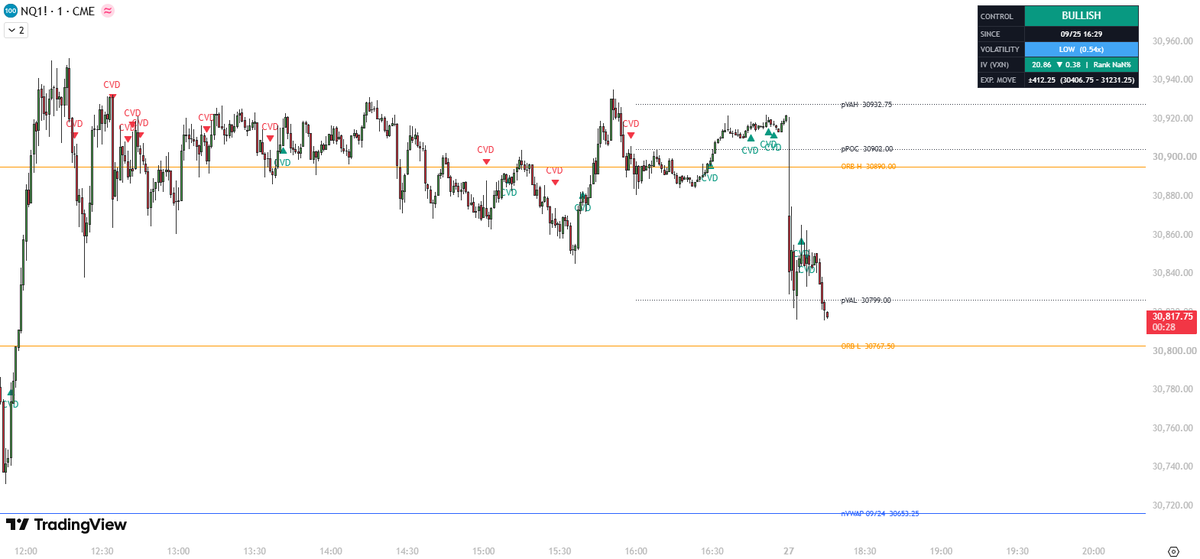
New update live $NQ indicator I'm building 👇
Added a live panel in the corner that shows:
• Daily expected move (±1σ), calculated from implied volatility at the open
• Implied vol live: rising or falling, + where it sits vs the last year
• Current volume activity: very high → very low vs the same time of day
The expected move tells you how far the market is pricing today.
The vol read tells you if there's actually fuel to trade, or if it's a chop day to sit on your hands.
More coming soon.
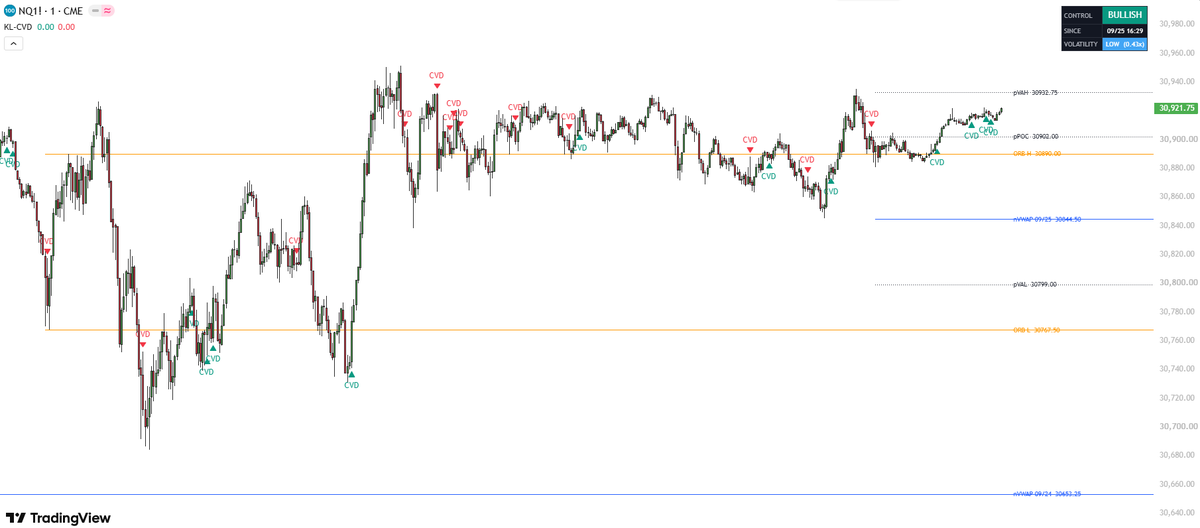
Sneak peek at the custom indicator I've been building for $NQ 👀
On the chart, automatically:
• Previous day VAH / POC / VAL
• Naked daily VWAP closes (last 3 days)
• 15 min ORB high & low
• Live volatility read based on contracts traded
The CVD markers are NOT entry signals. They show you in real time who's in control, bulls or bears, by spotting divergences between order flow and price.
More coming soon...
I told you yesterday that it would be a bad day to trade my strategy. The best setups happen when we open near the last day VAH or VAL… This way you can easily play the reversal👍
$NQ key levels for tomorrow
Daily VAH: 30,854.75
DVWAP: 30,811.00
Daily POC: 30,749.25
Daily VAL: 30,648.75
Below the beige zone (sub-30,648), I'm not looking for longs without clear structure first, no reason to buy weakness on hope.
Base case is an open back inside value. If that's what we get, it'll most likely be a balance day, chop, no edge and I'll sit it out.
Knowing when not to trade is part of a good adaptive strategy.
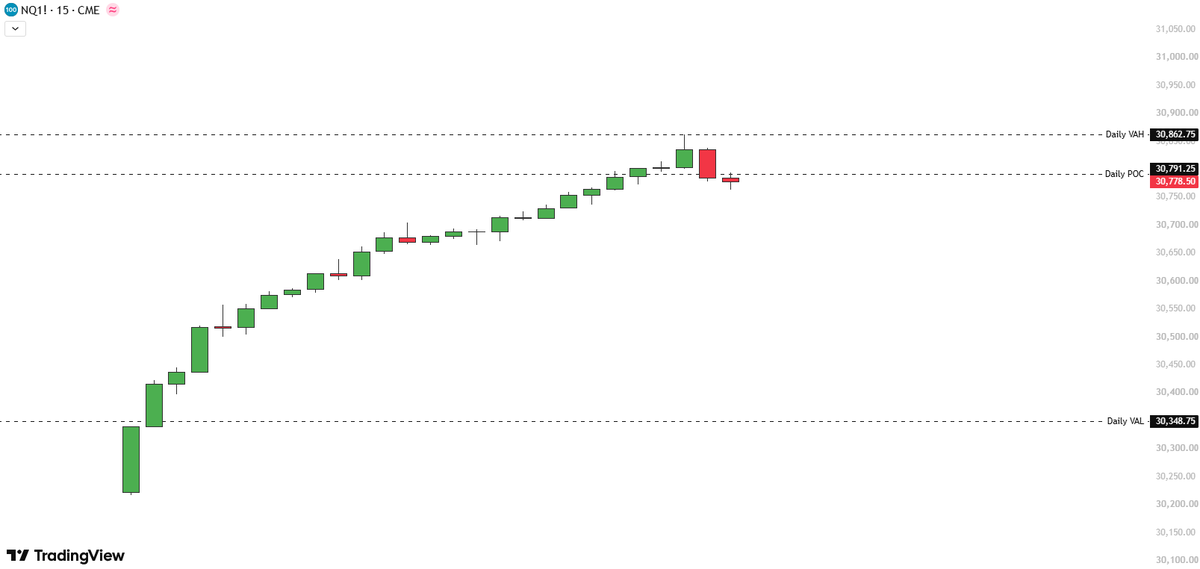
$NQ levels for today's session
- VAH: 30,862.75
- POC: 30,791.25
- VAL: 30,348.75
Interesting one. We're opening right on the POC after yesterday's clean, stair-step rally off the VAL. That kind of open usually means the market hasn't picked a direction yet, and the first move tends to tell the story.
Two ways I'm framing it:
📈 Acceptance above POC → retest of VAH, and if we get through that with volume, the trend from yesterday still has legs
📉 Rejection back below POC → rotation back into value, VAL becomes the magnet for a fill
Watching the first 15-30min to see which side wins before I commit size.
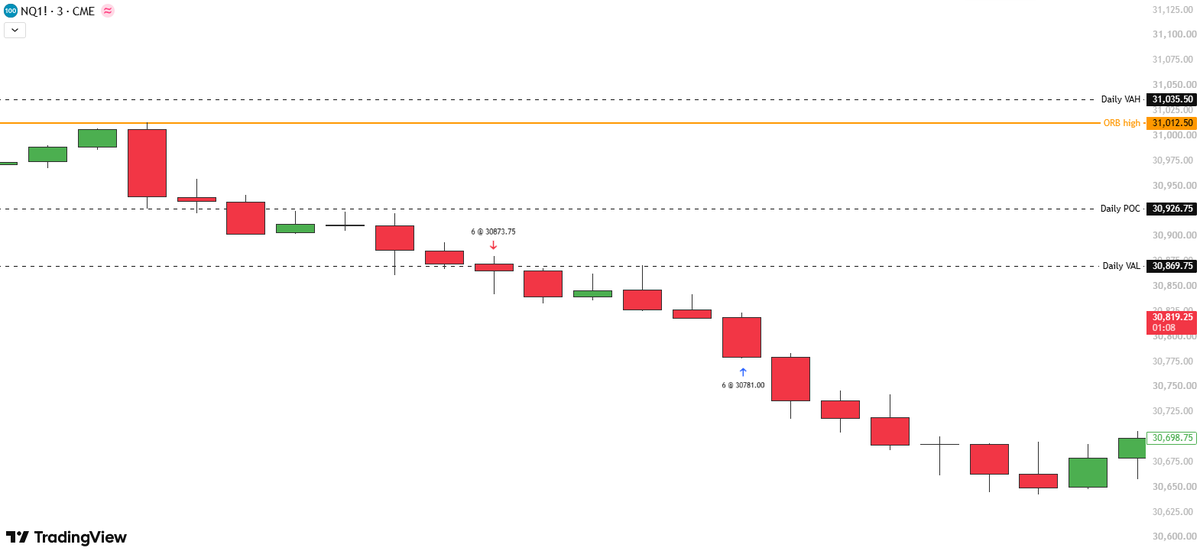
Trade recap $NQ
Opening range high (31,012.50) rejected right under Daily VAH (31,035.50). No acceptance above value.
Let it come in through Daily POC (30,926.75). Shorted 6 @ 30,873.75 as price lost Daily VAL (30,869.75). Value breaking down and CVD pushing lower is my confirmation.
Covered 6 @ 30,781.00 into the air pocket below. 92.75 pts.
Just knowing where value sits and trading the reaction to it. That's the whole edge and it's learnable.
I don't post my PnL because it's useless for learning. My goal is to promote good habits and a real strategy.
$NDAQ
The last leg of every bull market always feels magnificent. Not because fundamentals suddenly become perfect, but because psychology reaches its peak. At first, smart money buys quietly when nobody cares. Then institutions step in. Then the media starts paying attention. But the final phase? That’s when the public arrives.
Prices go vertical because greed becomes stronger than logic. People stop asking “is this overvalued?” and start asking “how high can it go?” Every dip gets bought instantly. Everyone suddenly becomes a genius trader.
Screenshots flood social media. Friends who ignored the market for years start asking how to buy.
This is where FOMO explodes.
The reason it always follows the same pattern is because human emotions never change. Fear, greed, euphoria, and envy repeat in every cycle : stocks, crypto, real estate, all of it. The final leg is powered less by value and more by momentum and belief. People see others getting rich and feel pain staying on the sidelines.
That emotional pressure creates a feedback loop: Price rises → attention rises → new buyers enter → price rises even more.
That’s why the end of bull markets often looks irrational and unstoppable. It’s the moment where the market transitions from investing to pure speculation.
And ironically, the stronger the euphoria becomes, the closer the cycle usually is to ending.
Different asset. Different year. Same human behavior. Same pattern every time.
When is the final leg? I don’t know but I feel we are getting much closer to it now…
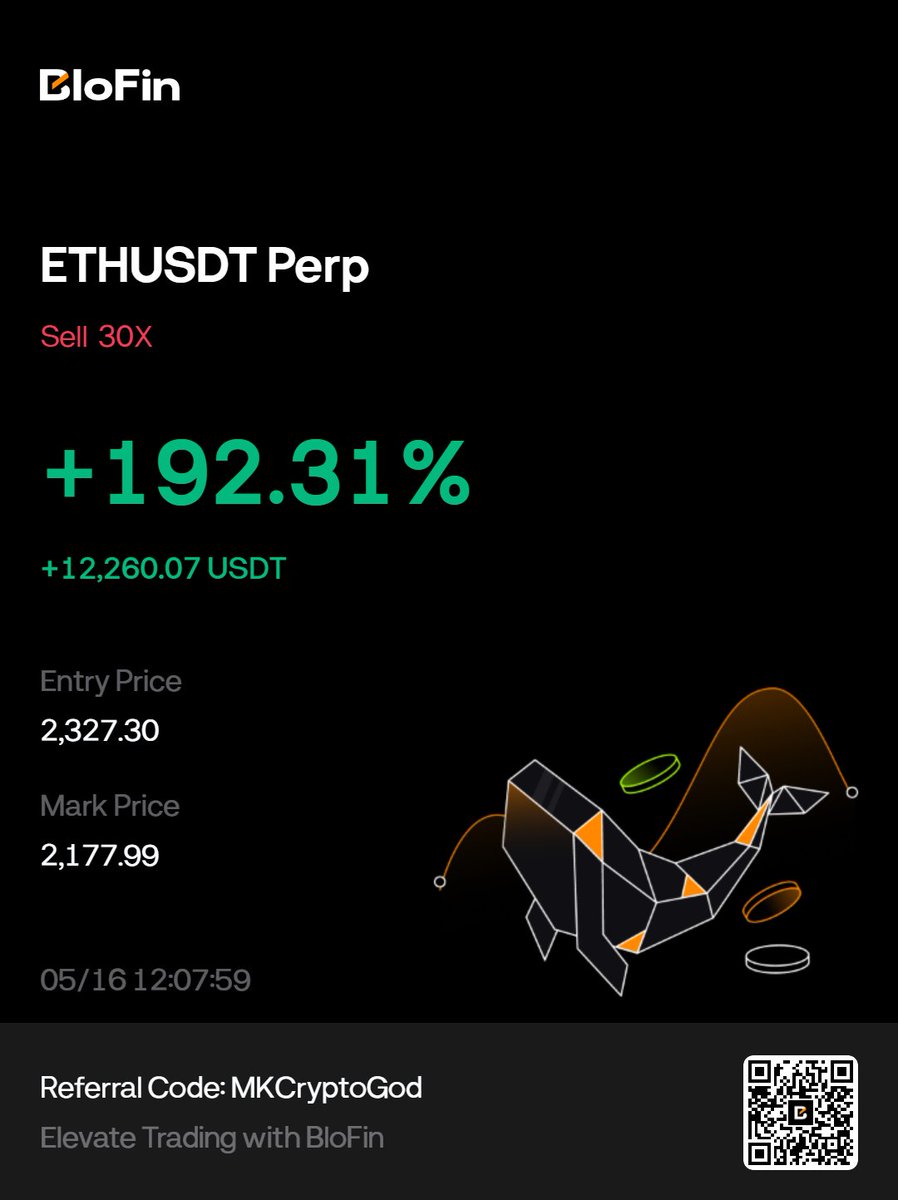
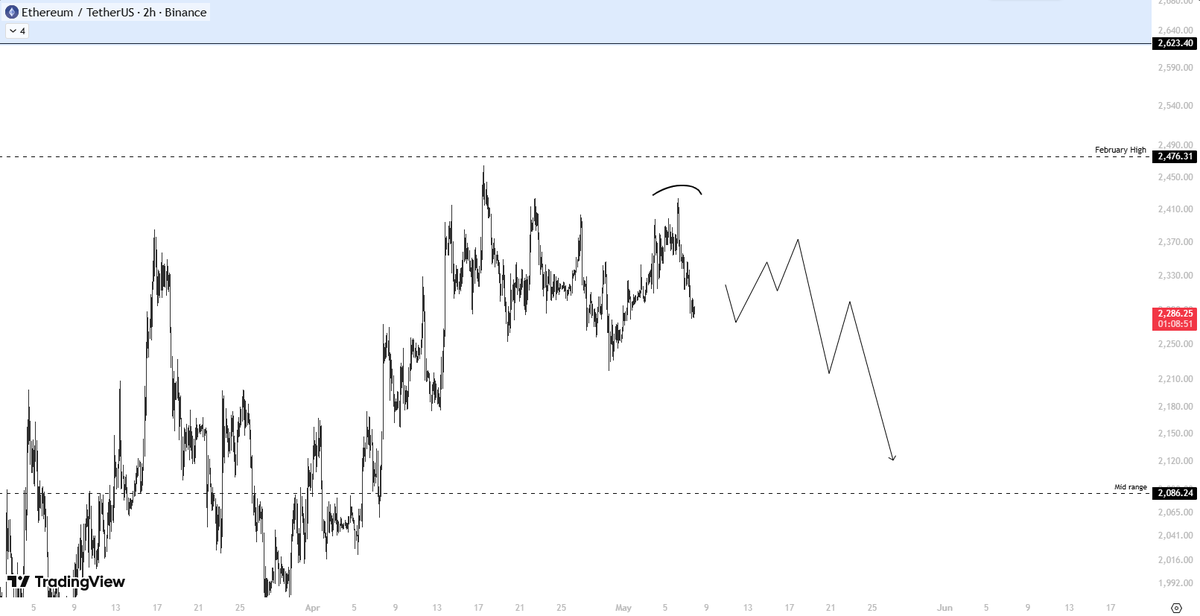
My $ETH short is my biggest future position this year…
I don’t want to see that much absorption in the NY session tomorrow if we push south again
I will update my pnl tomorrow
Good night fam💙
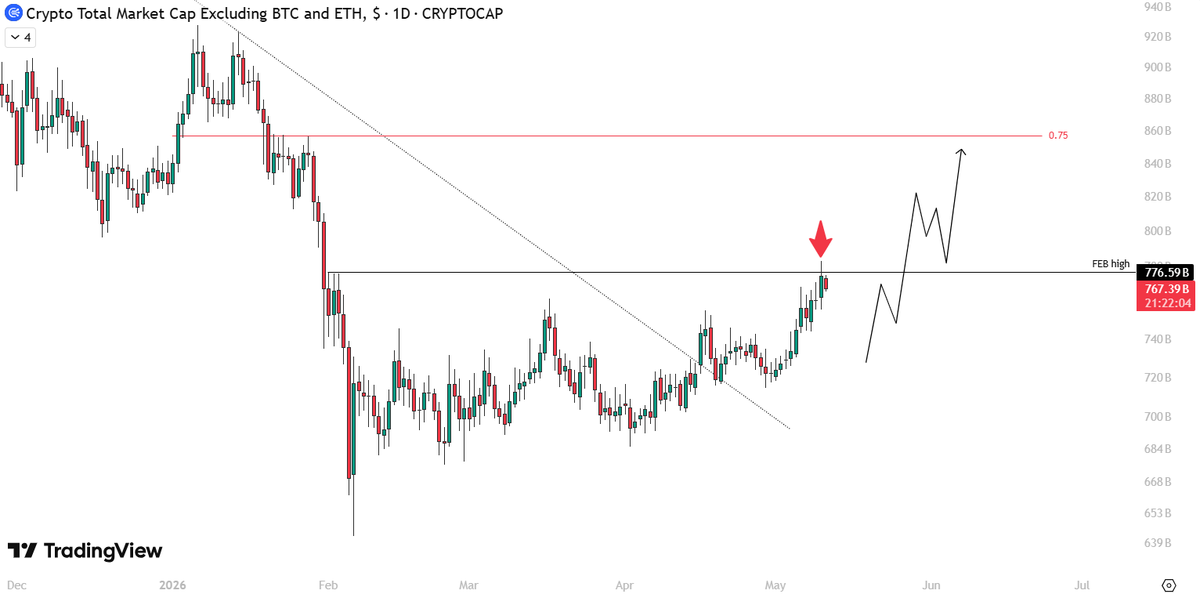
$TOTAL 3 I sold the local top
I identified last week the Feb high as a very high probability of trapped longs in this area. I shorted a lot of $ETH with my longs profit on altcoins.
I teach you how to always rotate your capital properly in this market🫡
$ETH short update
I added more to my position under my initial entry point like I told you this week. My final target is the mid range to secure around 20k pnl.
I took very few trades this month and it's the only way to succeed in trading. As a retail investor, you have to acknowledge that you have access to the same retail tools as very other retail trader. The institution traders and investment firms are much more powerful and smart than you, me and every retail trader out there. Forget the noise and place positions you have an insane amount of confidence in.
It took me 7 years before understanding how the markets rotate and move. Still to this day, I have a lot more to learn.
Cheers :)
$TOTAL 3 February high taken.
I want to play this one more conservatively and take major profits home today. After reclaiming such a significant point of interest, this feels like the most rational decision.
This is not just another random high. It marks the beginning of the last 3-month trading range which is an area where retail participants finally start seeing green charts again after months of pain and begin chasing momentum late. Late longs often get trapped and price roll over... I've seen this pattern numerous times over and over again.
I’d rather stay patient and inverse the crowd here. Over the long run, that approach consistently performs better.
After 7 years in these markets, one thing I can confidently say is this: buying altcoins at these prices after a day like today is, 9 times out of 10, a very bad idea.
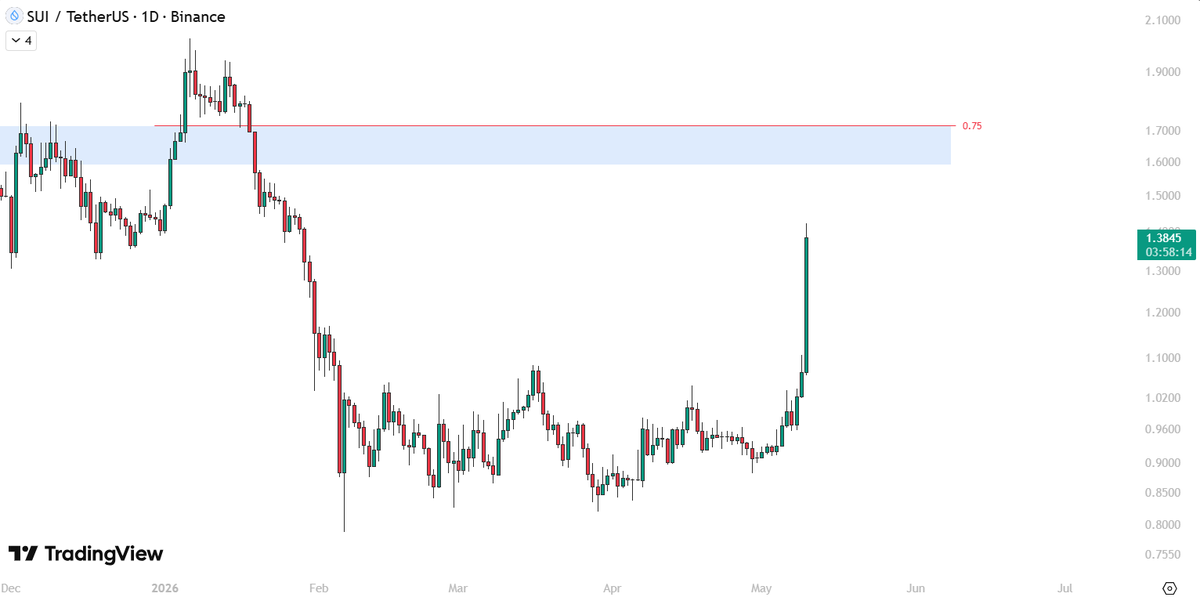
$SUI be careful ...
I would not try to build short positions before price reaches the 1.6 single prints. The blue box is the key level to start looking at late longs trapped positions. Before we reach 1.6, every drop is just random noise.
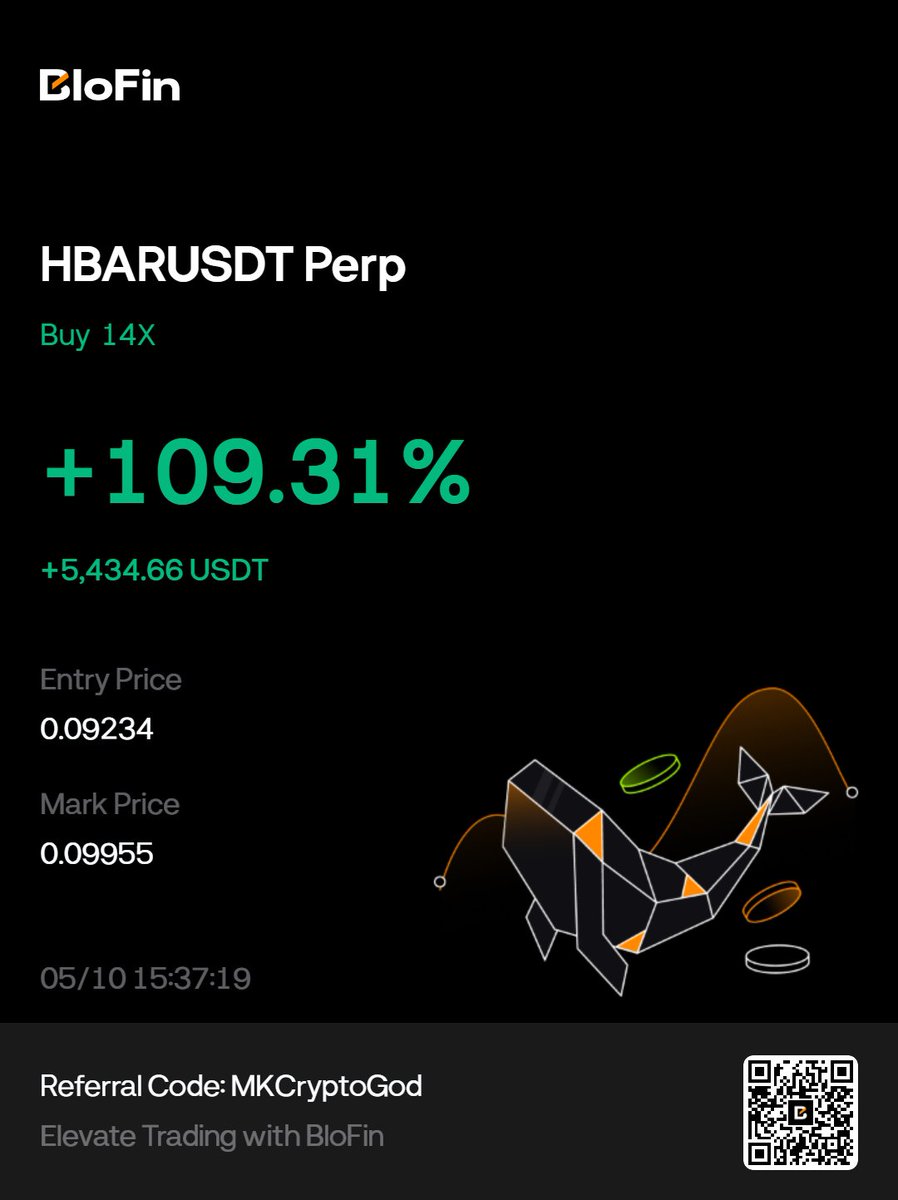
hedera-hashgraph:native up 7% today
Compression ranges are where price gets trapped in a tight area for hours or even days while volatility slowly dries up. The market looks “dead,” volume fades, both longs and shorts get chopped, and people start forcing trades out of boredom. But that compression is usually energy building underneath the surface. The longer price accepts a range without fully breaking, the more aggressive the expansion can become once liquidity finally gets taken. That's just basic finance 101. The more people fight over something (price in that case) the more the movement will be brutal.
That’s why patience matters more than prediction. I wasn’t trying to guess the exact candle or top tick. I was waiting for the market to prove that expansion had started. A single daily candle above 7% is not random noise anymore. It’s a shift in participation, momentum, and positioning. That’s where volatility returns and asymmetric opportunities appear.
You can’t time the breakout perfectly. Nobody consistently can. But you can prepare for it: define levels, study liquidity, understand where trapped traders are positioned, and stay disciplined enough not to overtrade the compression itself. Trading is less about predicting the future and more about being prepared when the market finally reveals direction.
Enjoy your Sunday :)
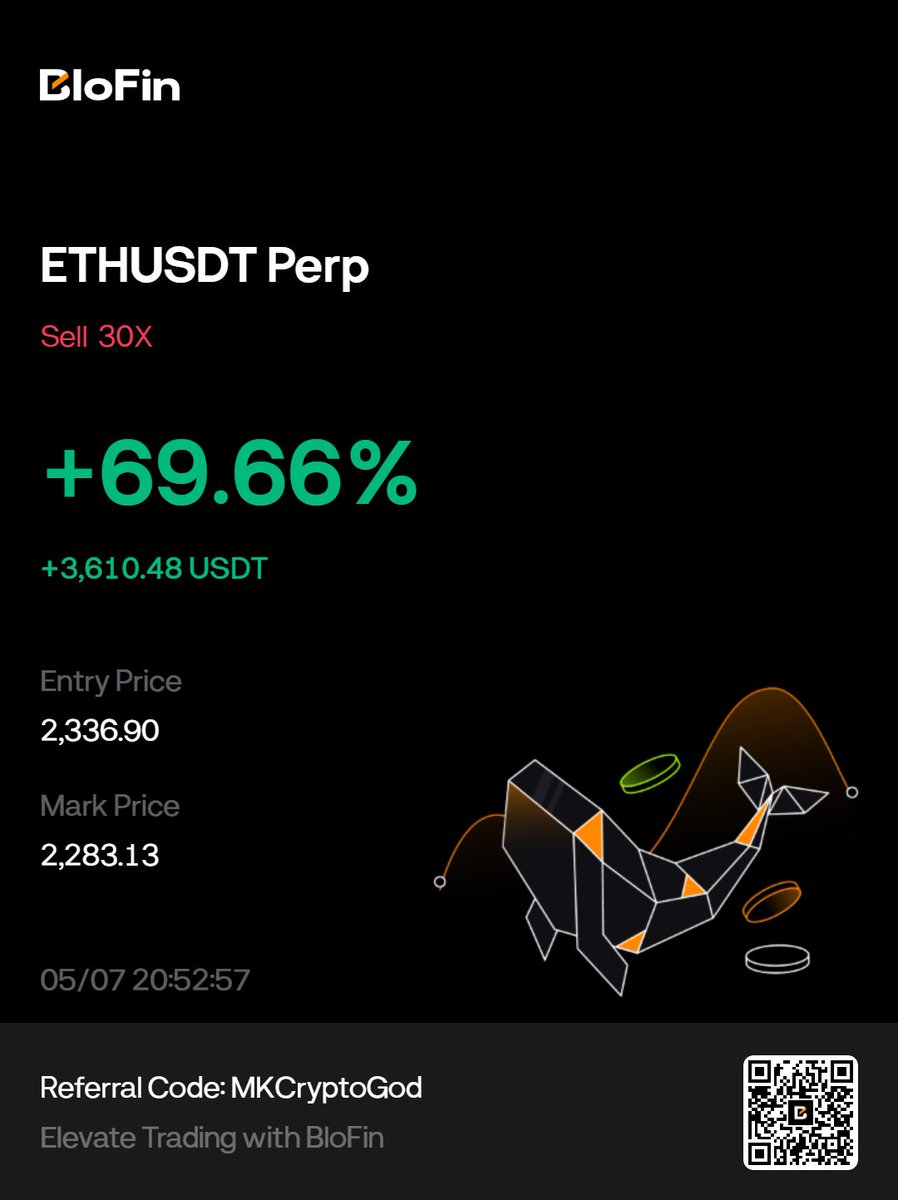
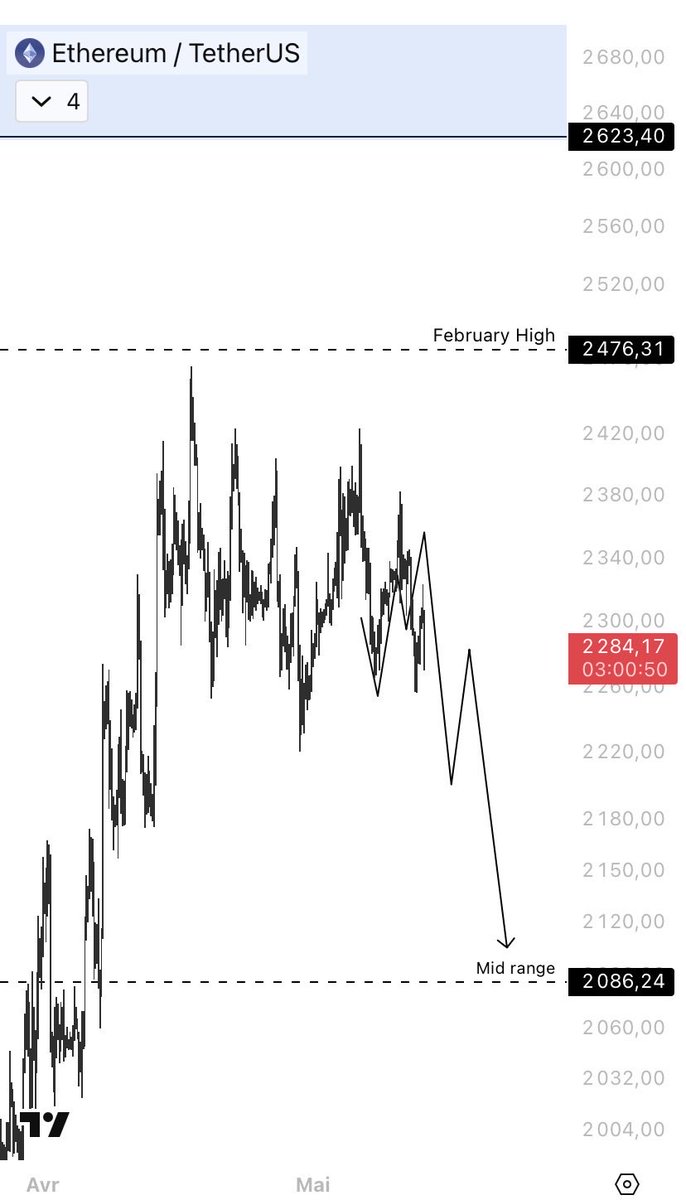
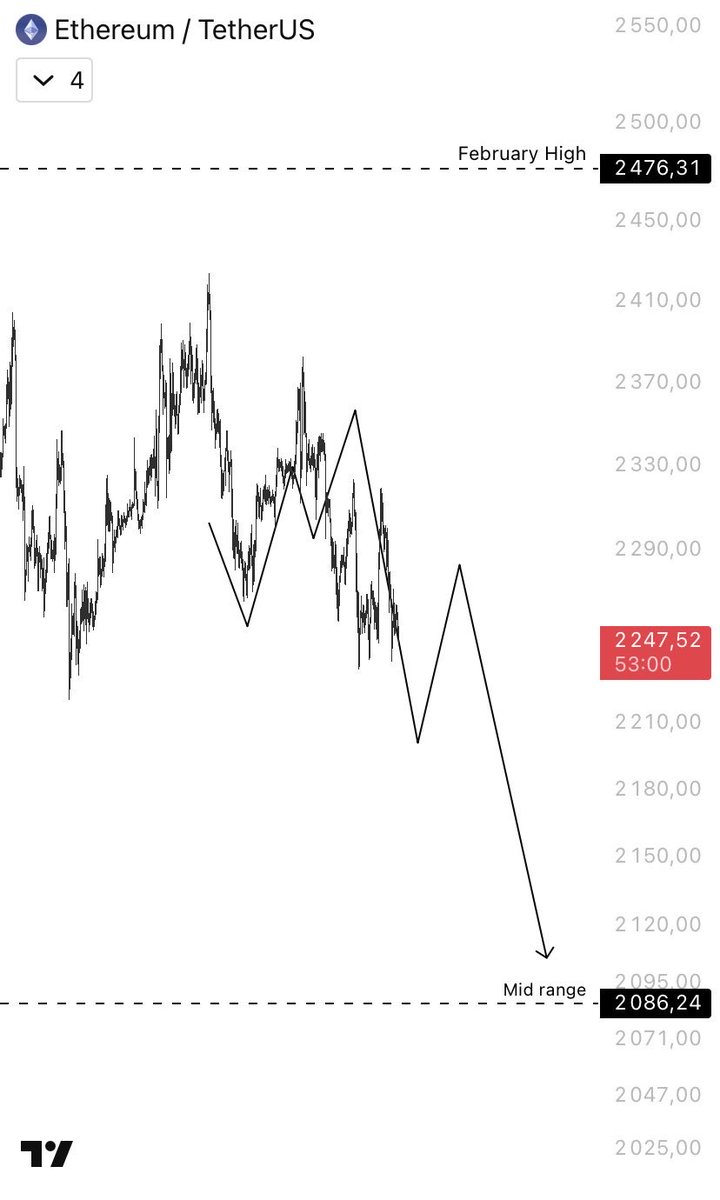
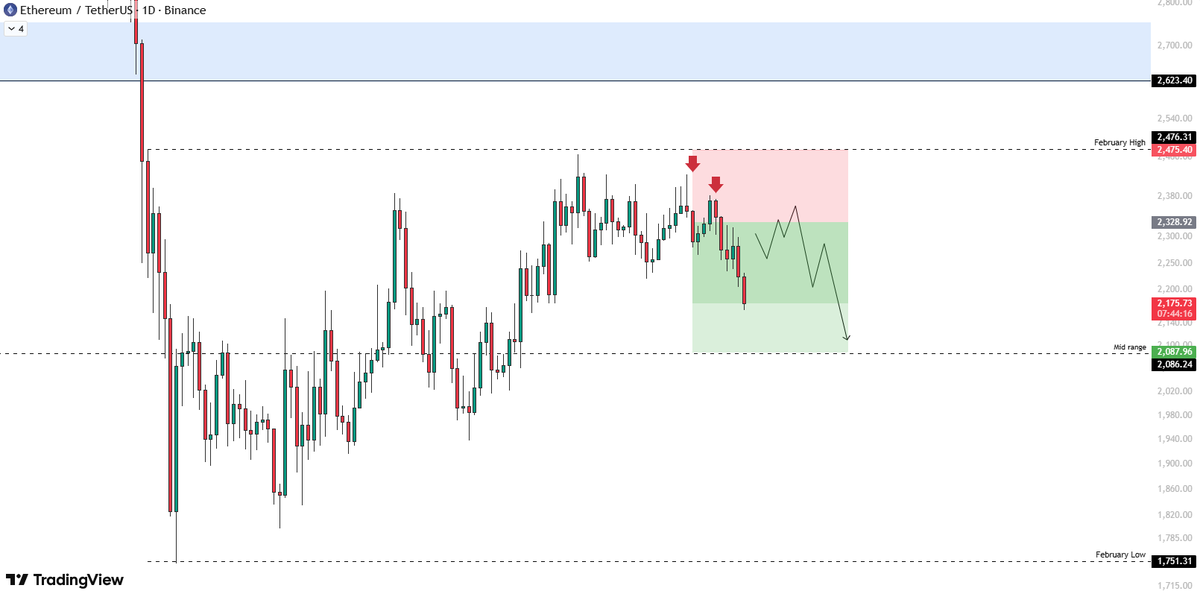
$ETH short update
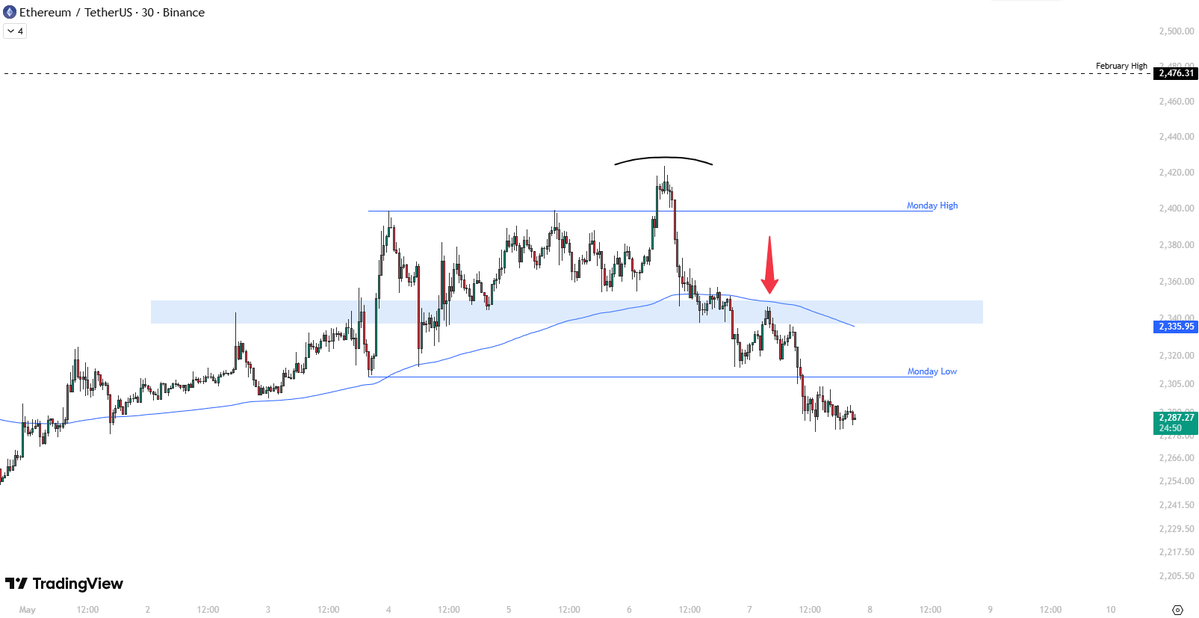
TF context first: ETH was trading below the February high and failed to accept above Monday high after sweeping liquidity into late longs near the top. The move into 2410-2420 looked aggressive, but footprint showed heavy buying getting absorbed instead of continuing higher.
That was the first warning sign.
I didn’t short immediately. I waited for confirmation:
1.rejection from the highs
2.failure to reclaim Monday high
3.weekly range flip
4.EMA retest into prior support turned resistance
The key zone was around 2330-2340.
On the retest, passive sellers stepped in again. Buyers could not push price back above the range/EMA, despite volume coming in. That told me the market was accepting lower prices.
Entry: ~2336
Current price: ~2283
The idea was simple:
liquidity sweep → absorption → range flip → failed reclaim → continuation lower toward mid-range liquidity.
Not trying to predict the exact bottom. Just following orderflow and market structure.