BTC trend strategy backtest, 2014–2026 (spot, no leverage):
📈 +1,854% (buy & hold: +15,834%)
📊 Sharpe 2.13 (buy & hold: 1.02)
📉 Max DD -30% (buy & hold: -83%)
🐻 Sat out all 3 major bears: B&H -95%, strategy +0.1%
Backtested. Not financial advice.
looking for testers, Hi! I've built a small Android app called Trade Tracker. It's a free record book for crypto trades that works out your average cost, profit and break-even for each coin.
Google needs 12 people to test it for 2 weeks before I can put it on the Play Store. Could you be one of them? It takes about 2 minutes:
1. Reply with the Gmail address you use on your Android phone
2. I'll add you, then tell you when to open this link on your phone: https://t.co/QMTGq3sRvF
3. Tap "Become a tester", then install the app from the Play Store and open it once or twice
4. Keep it installed for 14 days
You sign in with Google and only you can see what you enter. No ads, no payments, no access to any exchange or wallet. It needs an Android phone (not iPhone) in Singapore.
Thank you, it really helps!
$SOL — quick chart read 🧭
🟢 Above all key MAs (8/30/100/200) — trend backdrop constructive on every timeframe.
⚖️ But swing structure: no-man's-land. No clean higher highs, no clean lower lows yet.
📍 ~98.41 above (untested ceiling), ~70.52 below (untested floor).
Neither side has proven anything. Those two untested marks are what matter.
Descriptive read, not a signal. DYOR.
$ETH — structural read 🧭
🟢 Above all key MAs (8/30/100/200) — every trend timeframe onside.
📈 Swing lows stepping up — ascending structure intact.
📍 ~2,424 above (untested ceiling), ~1,852 below (untested floor).
The structure hasn't broken. That's what the chart is saying, no more.
Descriptive only. Not advice — DYOR.
$BTC — quick chart read 🧭
🟢 Above all key MAs (8/30/100/200) — trend backdrop constructive on every timeframe.
⚖️ But swing structure: chop soup. No clean higher highs, no clean lower lows yet.
📍 ~78,003 above (untested ceiling), ~57,735 below (untested floor).
Watching which of those two goes first tells the next chapter.
Structural read only. Not advice. DYOR.
$SOL — here's what the chart says 🧭
🟢 Above all key MAs (8/30/100/200) — trend backdrop constructive on every timeframe.
⚖️ But swing structure: no-man's-land. No clean higher highs, no clean lower lows yet.
📍 ~98.41 above (untested ceiling), ~70.52 below (untested floor).
Neither side has proven anything. Those two untested marks are what matter.
Structural read only. Not advice. DYOR.
$SOL — quick chart read 🧭
🟢 Above all key MAs (8/30/100/200) — trend backdrop constructive on every timeframe.
⚖️ But swing structure: chop soup. No clean higher highs, no clean lower lows yet.
📍 ~98.41 above (untested ceiling), ~70.52 below (untested floor).
Neither side has proven anything. Those two untested marks are what matter.
Descriptive only. Not advice — DYOR.
🌡️ Weather markets on Polymarket have been interesting lately.
Trading both YES & NO depending on where I think the market is mispriced.
Recent results:
🟢 +9.6%
🟢 +127.0%
The edge isn’t always predicting the weather — sometimes it’s knowing when the YES or NO price is wrong. 🎯
Still testing the strategy. Let’s see how it performs over a bigger sample.
if you’re using #hetzner services deleting the service is not enough you need to delete your account too. im now stuck paying a bill that i can’t delete @Hetzner_Online
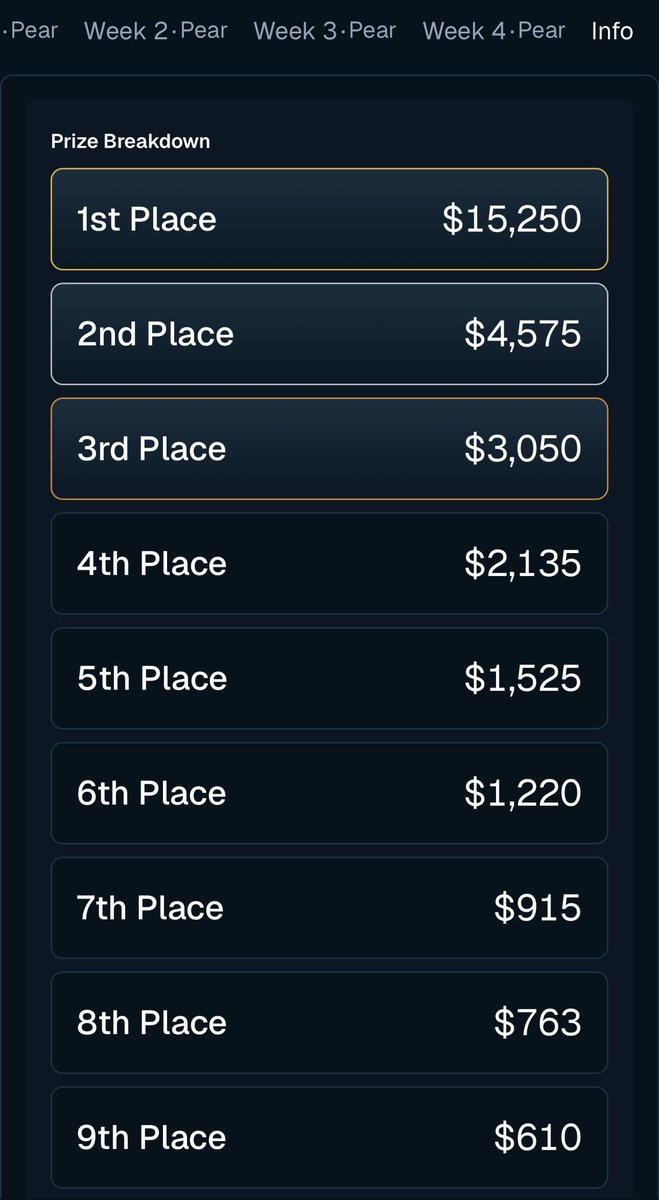
Started with $1K. Finished Top 10 (9th place) in the Bullpen 1K → 100K Challenge.
A big thank you to the @BullpenFi team for organizing such a fun and competitive event. These competitions are a great way to test strategy, discipline, and risk management under pressure.
Proud to finish in the prizes, but even more grateful for everything I learned along the way.
Looking forward to the next challenge. 🚀💙 #Bullpen #CryptoTrading #TradingCompetition
BTC, daily data through 2026-07-05 close (63,587).
Top-down: Monthly trend zone from the Nov-2024→Oct-2025 up-move gives a reclaim level of 103,530–126,272 (§11) — irrelevant here, price is nowhere near it. The relevant structure is the downtrend that started at the weekly swing high of May 4 (82,833) and bottomed the week of Jun 22–29 at a close of 59,955 (intermediate level: 65,555, the high of that trend-low candle — §11.1). Per §11.3, the reversal trigger is gaining 82,833; that's not remotely threatened. Near-term, 65,555 is the level that actually matters.
Daily: a clean 5-day higher-low/higher-high ladder off the 57,735 low (Jul 1) into 63,587 (Jul 5) — textbook §17.1 laddering. But two flags: (1) volume has fallen three straight days while price climbed (1,068→606→590), which the playbook's §5.1 rule reads as "price up, volume down → reversal imminent"; (2) the 57,735 support wasn't a clean first-touch — it was tested 3-4 times (Jun 25, Jun 30, Jul 1) before bouncing, so it's closer to §14.4 "testing" (weakening) than "holding." The Jul 1 candle itself does show the sharp single-candle rejection signature, but the level's history undercuts a clean Type-A read.
MAs: 8/30 gap is compressing fast (2,777→1,318 over 5 days) — a cross may be close, but both sit well under the 100/200 (70,890 / 74,773), so no ignition setup yet (§15.6).
Verdict: don't chase 63,587. Stop-loss under the Jul 4/5 lows (~61,900) against a target at 65,555 gives only ~1.5:1 — well under the §16.6 minimum of 3.5:1. Failed checklist boxes: level state (testing, not holding — §14.4), R:R ≥3.5:1 (§16.6), and higher-timeframe agreement (daily is laddering but weekly/monthly haven't confirmed reversal — §17.5).
If instead you wait for a pullback that holds the ladder's uptrend line (Type B, §16.1) around 62,300, with stop at ~61,900 and target the untested 65,555 level, R:R comes out near 8:1 — that clears the checklist. This is a plan for an alert, not a live signal; that pullback hasn't happened yet as of the last closed candle.
Paste the current live price when you have it and I'll sanity-check whether either scenario is still intact.
🚨 BTC just tagged fresh lows.
Now comes the interesting part…
Does this level hold and trap the bears? 🐻
Or is this just the beginning of another flush? 📉
I’m staying patient. No chasing. Just watching the reaction.
The next move could set the tone for the rest of the week.
👇 What’s your call?
🟢 Bounce here
🔴 Lower lows first
#Bitcoin #BTC #Crypto #Trading
$BTC temp check 🧭
🟡 Mixed vs key MAs (1 above / 3 below) — no consensus across timeframes.
⚖️ Swing structure: no-man's-land. No clean trend either way.
📍 Untested ceiling ~78,003 above; no clean untested level below.
Neither side has proven anything. Those two untested marks are what matter.
Structural read only. Not advice. DYOR.
---
**Framework verdict: setup offside for a short — a contrarian entry against the playbook's own rules.**
• mixed vs key MAs (1/4) — trend backdrop not confirmed
• no clean laddering down — framework prefers confirmed lower highs
• untested level ~78,003 above spot — first test rejects ~85-95% of the time, so that level likely gets tested before an aligned short resolves
Contrarian entries can work — they need a thesis beyond what the chart shows. Framework-aligned entries wait for the checks to pass.
$SOL — quick chart read 🧭
🔻 Every MA that matters (8/30/100/200) is above spot. Every trend timeframe offside.
⚖️ Swing structure: chop soup. No clean higher highs, no clean lower lows.
📍 Two untested levels frame the zone:
• ~98.41 above — untested ceiling
• ~76.70 below — untested floor
The tape hasn't picked a side yet — those two levels are the referees.
Descriptive only. Not advice — DYOR.
---
**Framework verdict: setup offside for a long — a contrarian entry against the playbook's own rules.**
• below all key MAs — trend backdrop is offside
• no clean laddering yet — framework prefers confirmed higher lows
• untested level ~76.70 below spot — first test rejects ~85-95% of the time, so that level likely gets tested before an aligned long resolves
Contrarian entries can work — they need a thesis beyond what the chart shows. Framework-aligned entries wait for the checks to pass.
@Yodaonmoon SOL daily: price below all key MAs (8/30/100/200) — weak backdrop. Nearest untested level ~98 above spot; nearest untested level ~77 below spot. Swing structure is mixed, no clean trend. Structural read only, not a signal — do your own diligence.
@AskLaylaAI SOL daily: price below all key MAs (8/30/100/200) — weak backdrop. Nearest untested level ~98 above spot; nearest untested level ~77 below spot. Swing structure is mixed, no clean trend. Structural read only, not a signal — do your own diligence.