this article follows the history of US's internment of Japanese Americans after the attack on Pearl Harbor. Though the interment order was repealed after the war, individuals who were interned received no compensation or formal apology until 1988. The article doesn't include-
On this day in 1942, the United States evicted Japanese Americans from their homes in Washington and forced them into internment camps. To overcome racial inequality, we must confront our history. https://t.co/KHa43oT6wh
$20,000 redress per survivor and why/how the government might have came to decide on this sum. Moreover, what percentage of Japanese Americans during this era were interned?
here is a rough sketch of how i want my poster for the #math530 data visualization project to look. currently i want to look at the different chain beverage stores location vs the racial demographic of massachusetts, specifically i also want to investigate if regions with (1/2)
guarantees the success of Amazon's pledge. I wonder how Amazon will be keeping the public updated on the progress of this initiative. What kind of statistical data might be relevant for it to disclose?
#Math530 This is the article that I read for my twt journal entry today. It discusses how Amazon is pledging a water-positive commitment to return more water than it uses by the year 2030. The 4 main strategies the plan consists of are water efficiency, sustainable resources,
community water reuse, and water replenishment. The article is published digitally by Business Wire, a company that disseminates full-text press releases from thousands of companies and organizations worldwide. Therefore, I believe that the news is true, but I don't think it
Since this article didn't do much statistical analysis with the data that they have, I wonder if we would to present this statistically, what kind of presentation would best fit our goals.
Hello everyone! I've actually since changed my research topic to look at how the follower count of celebrities can affect their net worth.
https://t.co/aoTCJDMJ2I
This article offers insight into how much influencers make on social media and the ways in which this works specifically. It divides influencers into categories of nano, micro, macro, and mega influencers based on their follower counts.
For my #math530 project, I’ve decided to pose my research question on whether or not there is a positive correlation between a city’s GDP and its population. I look forward to working on this project!
The article mentions 12-month changes and over-the-year changes; what’s the difference between the two? Since CPI is only a measure of the goods in the market basket, how does BLS know if the data they have of certain goods is conclusive of the entire trend?
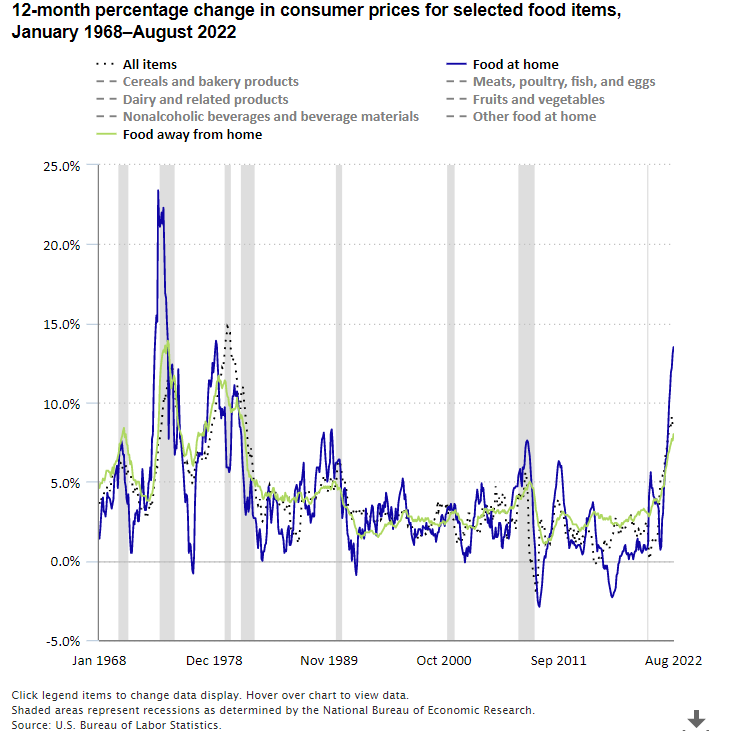
BLS publishes findings on changes in consumer prices in 12–month percentage changes. One of the most outstanding conclusions drawn from this data is the increase of prices for food at home: at 13.5 percent, it’s the largest 12-month increase since March 1979.
Although coming from a .gov doesn’t automatically mean that this data must be accurate, BLS as a well-established agency does lend credibility to this finding. These data are from CPI, which I learned in Econ is a useful tool in analyzing inflation but may contain errors.
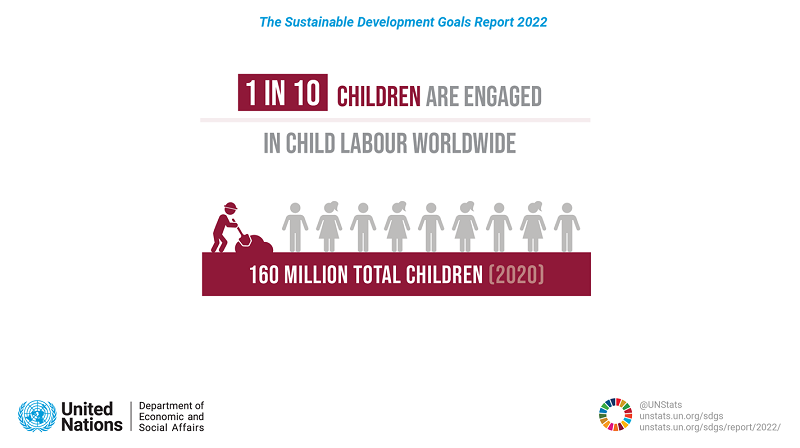
1 out of 10 children are engaged in child labour worldwide - nearly half of them are involved in hazardous work that directly jeopardizes their health, safety or morals. Check out more in the #SDGreport 2022: https://t.co/5ht3hartBg