Folks! We’ve got a new opening for a data analyst at @ArrowMcLaren! We’re working on many new and exciting things around performance and strategy research, and building out awesome #dataviz tooling to support our trackside engineering team. Check it out!
https://t.co/zrLyRxL9Ul
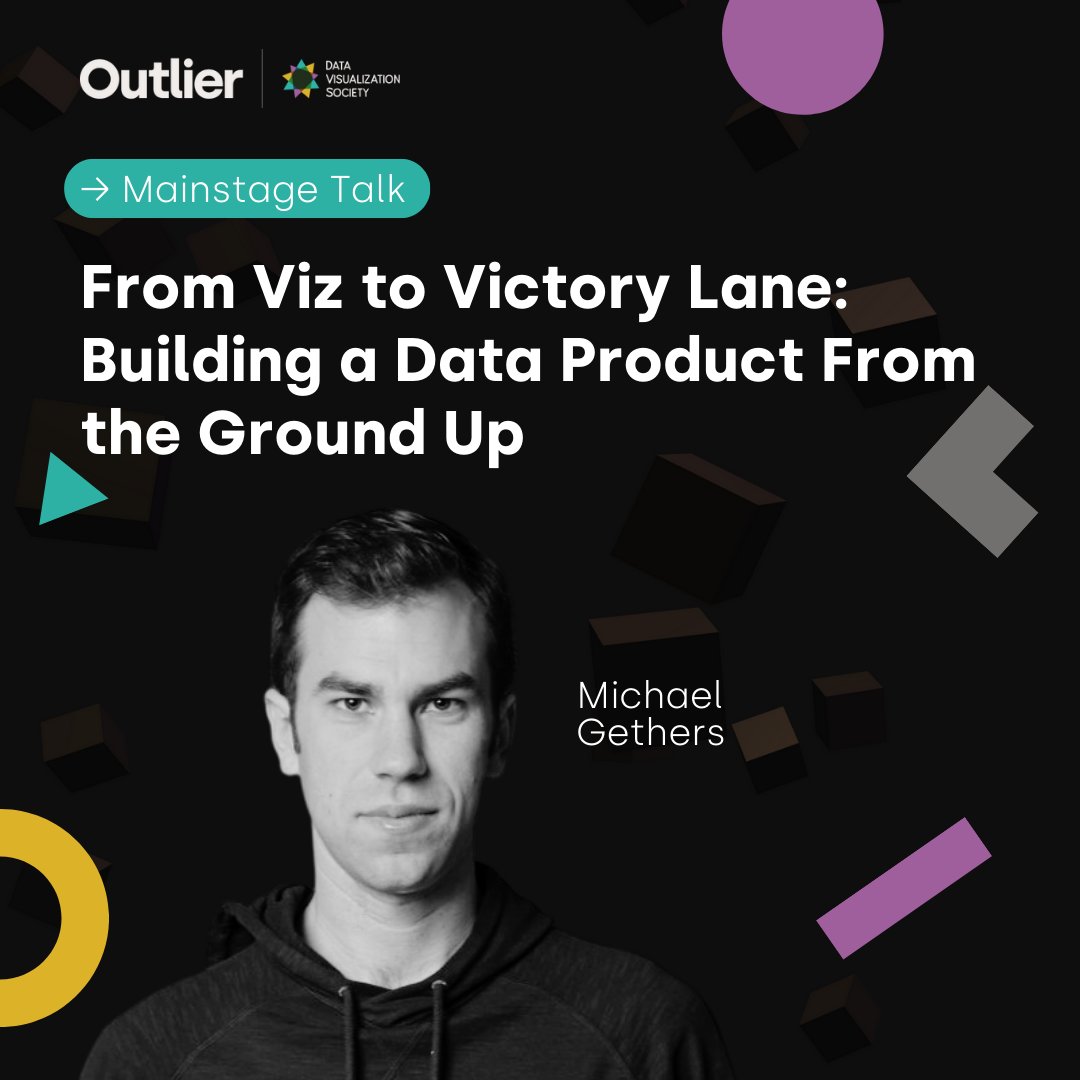
Meet our speaker: Michael Gethers, @michael_gethers
with a talk about Business Intelligence and Analytics
"From Viz to Victory Lane: Building a Data Product From the Ground Up”
Learn more: https://t.co/IPrnOpj2eQ
#outlier2024#dataviz#datavisualization
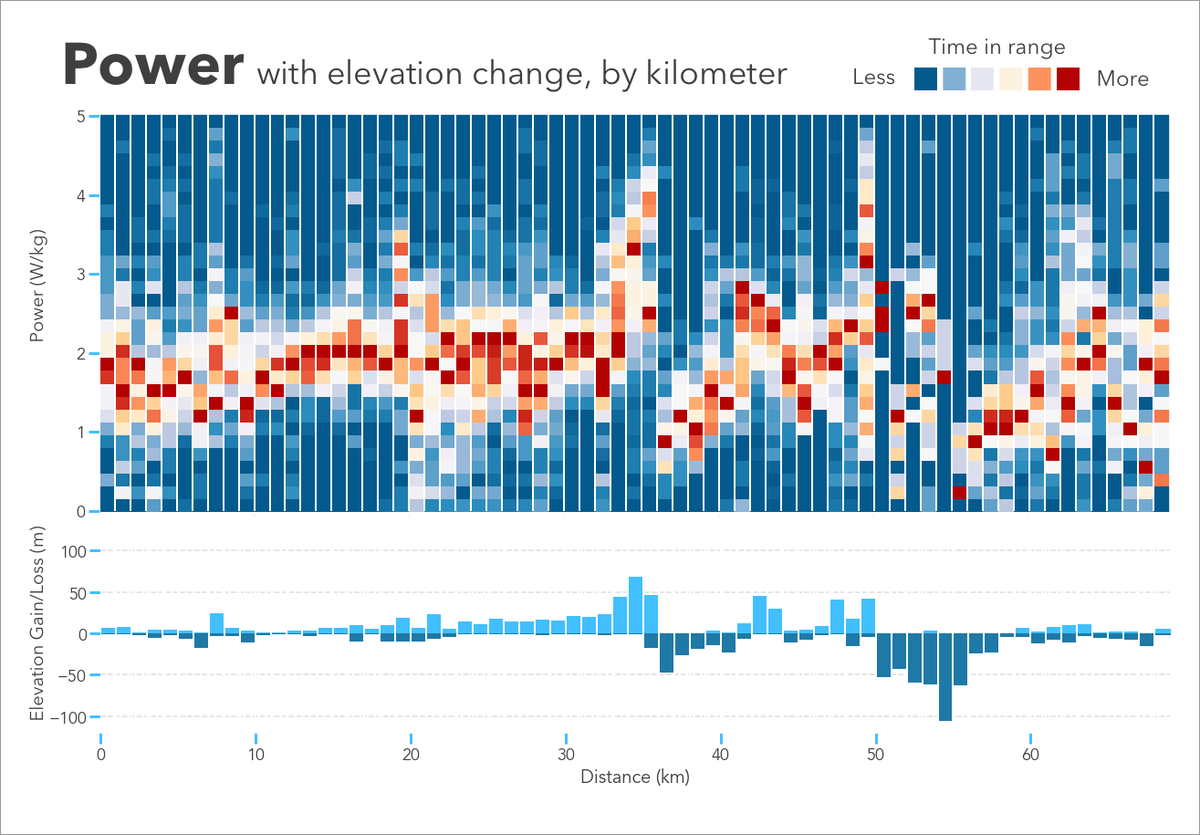
Another iteration on the #cycling power heat map. Each vertical strip represents 1km ridden, and the colors correspond to time spent in each power range during that km. This version also includes an elevation gain/loss viz, adding more context to the power chart above. #dataviz
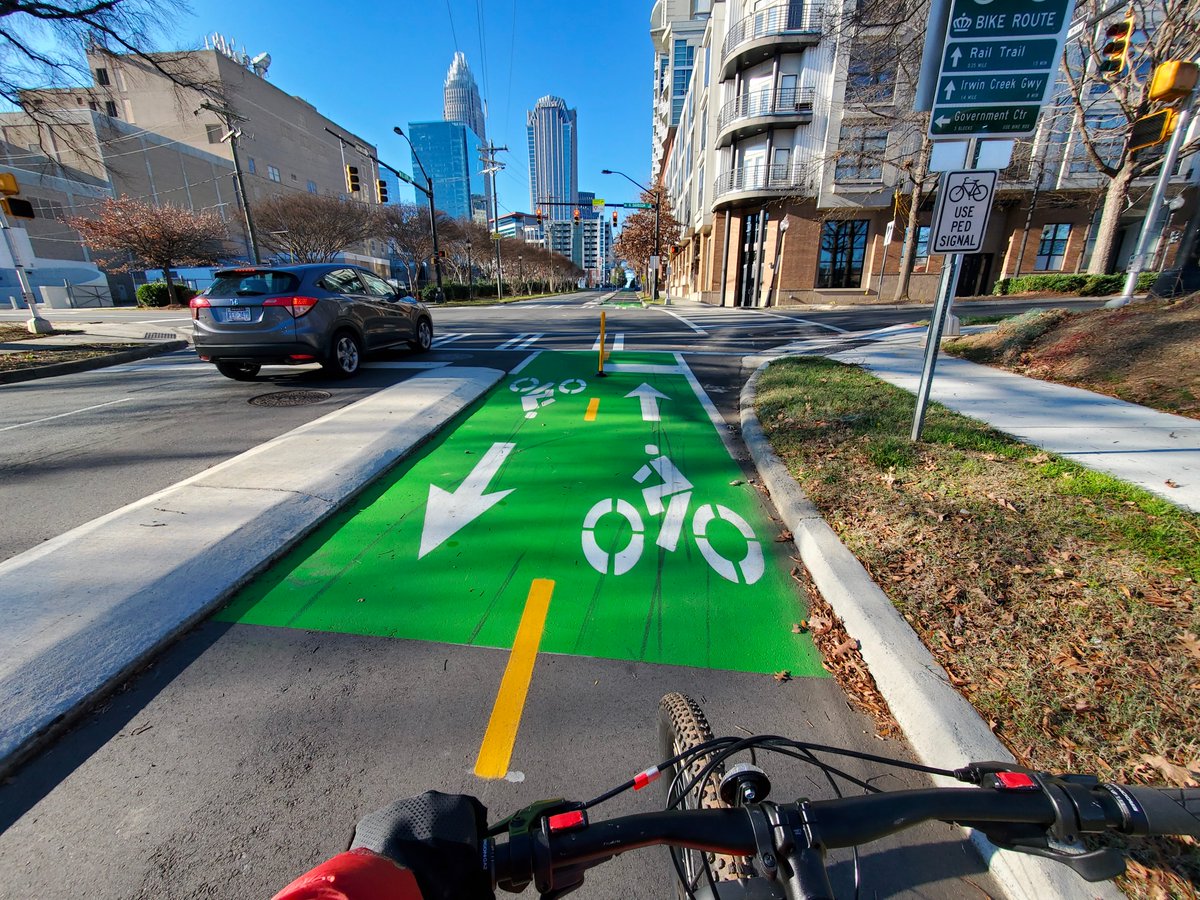
Wild you can get
-a whole emissions-free transportation system
-that makes your city healthier and more pleasant/less noisy
-for the cost of putting in a concrete slab to prevent its users from being hit by cars
And most cities still refuse to do it
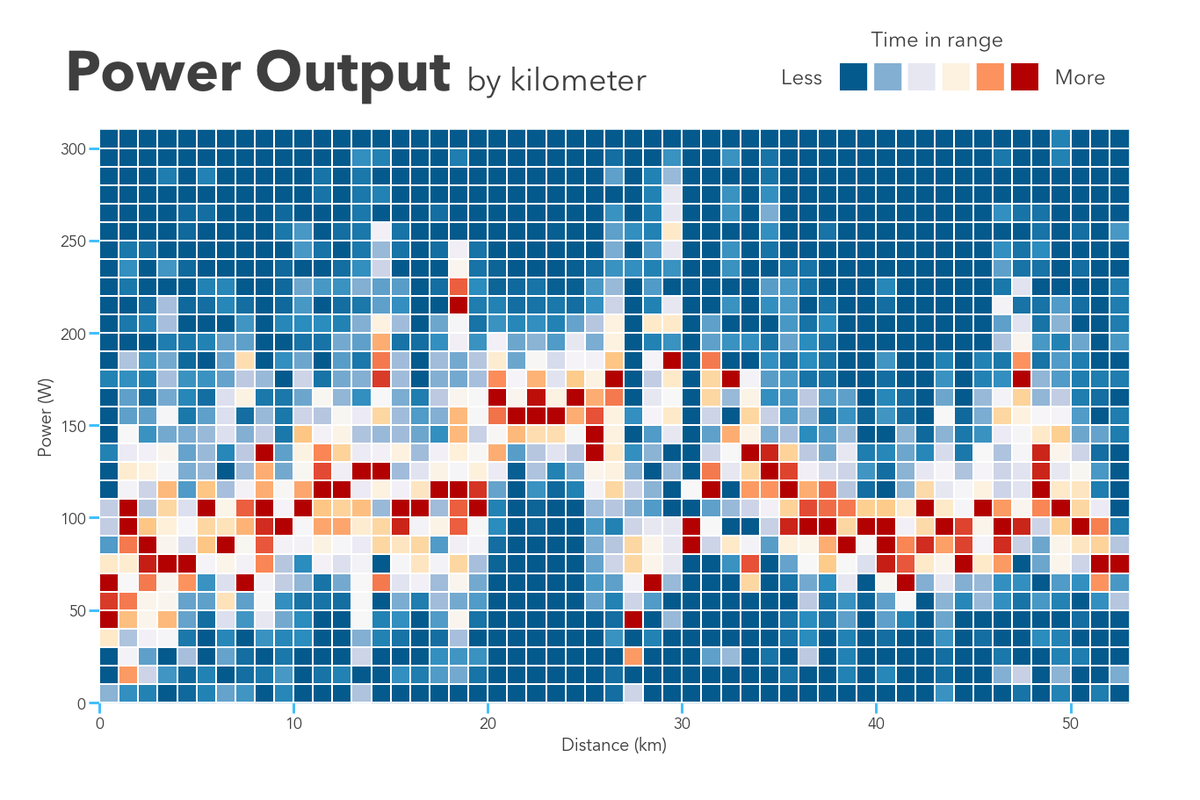
(1/4) Two representations of the same #cycling data: the first, my heat map illustration of rider power output. The heat map allows you to see a distribution of power throughout the ride, and still shows notable peaks and valleys along the way.
#strava | #dataviz
(4/4) Second-by-second output data isn't that valuable for what is ultimately a high-level chart. Aggregating the data (in my case, aggregating by km) and presenting the distributions within those aggregations seems to be an improvement, at least for my use.
#strava | #dataviz
(3/4) There is also certainly (and necessarily) some smoothing happening here make it consumable on a small screen, but in doing that, you lose a lot of the data around the distributions therein.
#strava | #dataviz
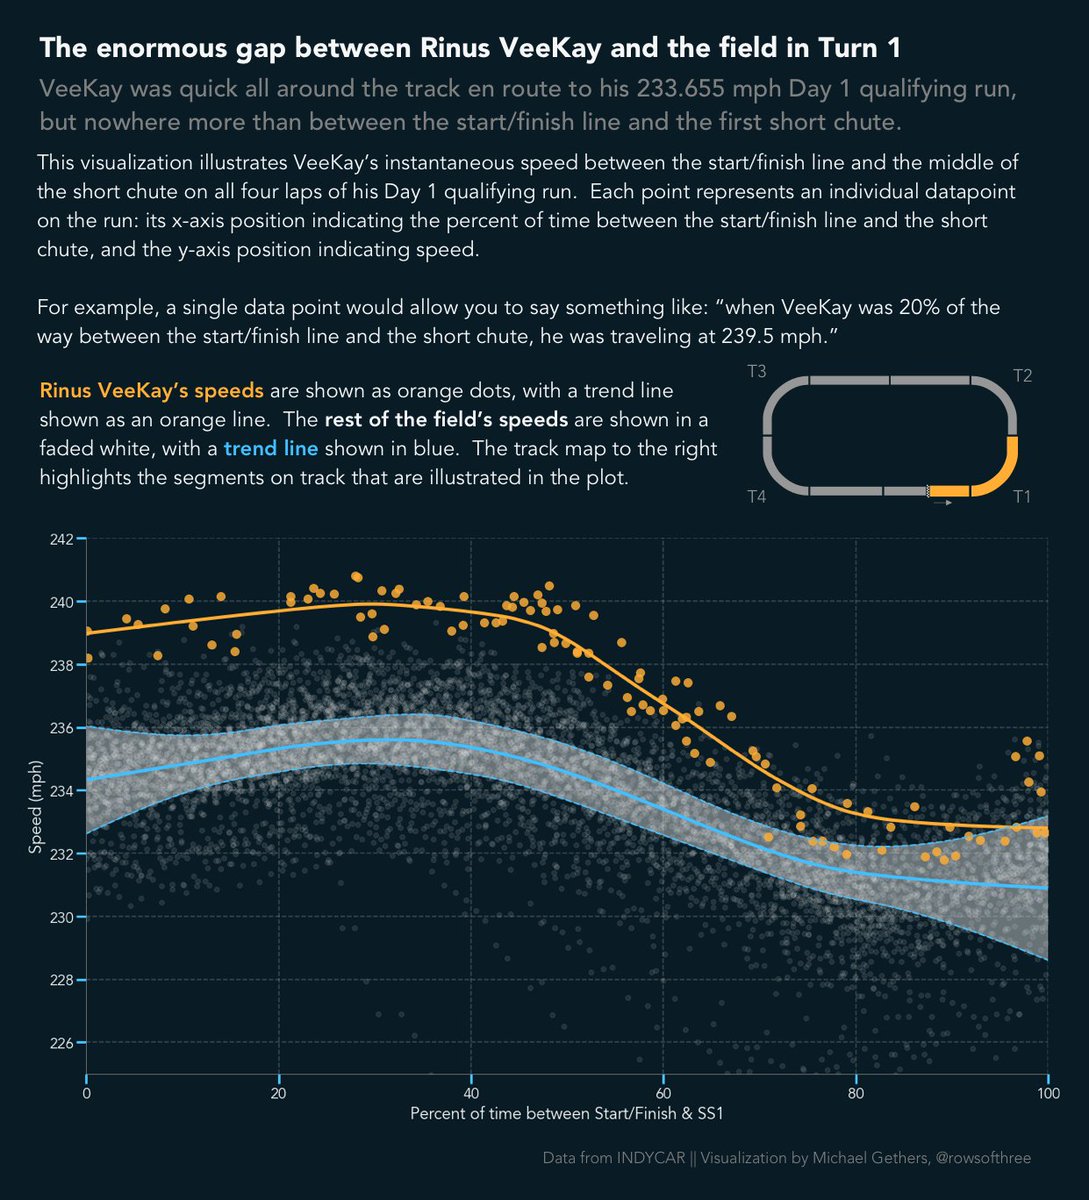
The plot on the bottom is the real meat of this graphic, but it loses context without the track maps on top. We're able to paint a clearer picture of overall on-track race pace by combining multiple visualizations than we could with any single one of them alone. #dataviz
Illustrating the impressive consistency of #INDYCAR driver Scott Dixon in the closing stages of this past weekend's #IndyTO. Most striking about the effort was his ability to hold a steady gap over 2nd place finisher Colton Herta over the final 20 laps, which we highlight here.
We're all aware by now: @rinusveekay was absolutely ripping in his Day 1 qualifying attempt. But look at the delta between him and the rest of the field in the segment from the bricks to the short chute. Eclipsing 240 going into turn 1...impressive #Indy500#IndyCar
Folks! For those looking for a #IndyCar stats/viz, I'm shifting those posts to a new account, @rowsofthree. It will be dedicated solely this kind of content, freeing this personal account up for some additional topics. Follow along over there if you'd like!
Sensing a pattern here...the top 6 in the #FirestoneGP were generally quick in corners, but less so in the straights: *all* of them were below median entering turn 1. Not the only factor that put them up front, but informative w.r.t. the setup strategy of the top teams #INDYCAR
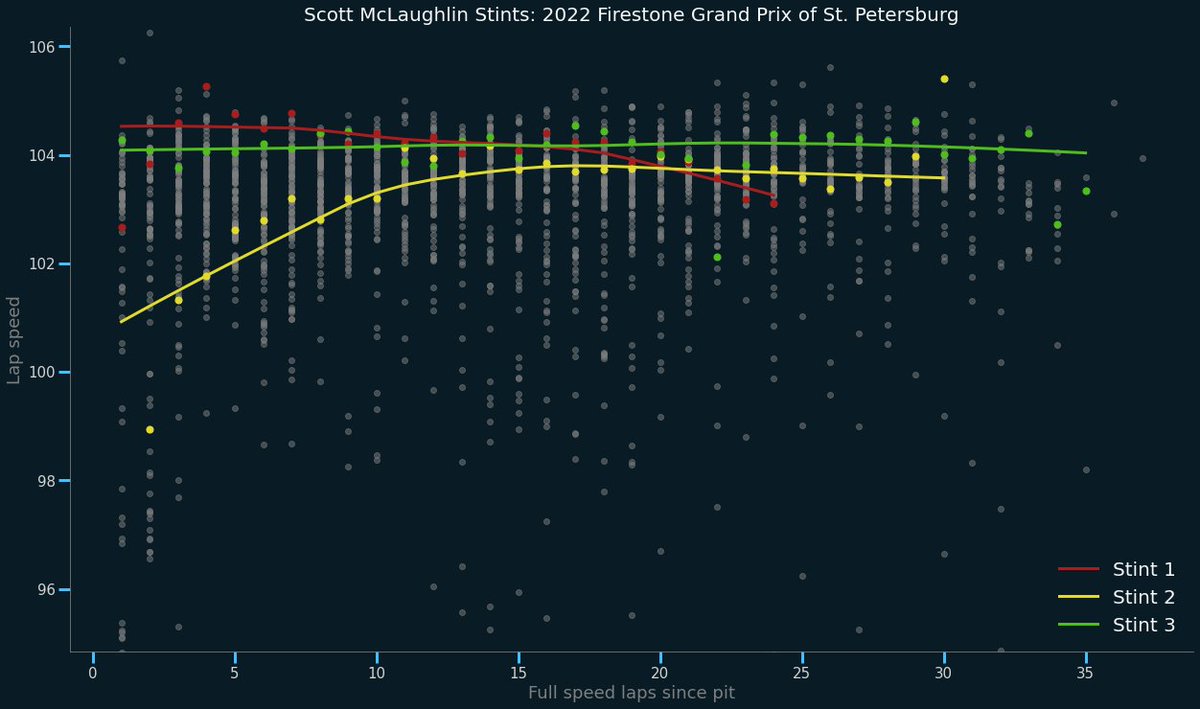
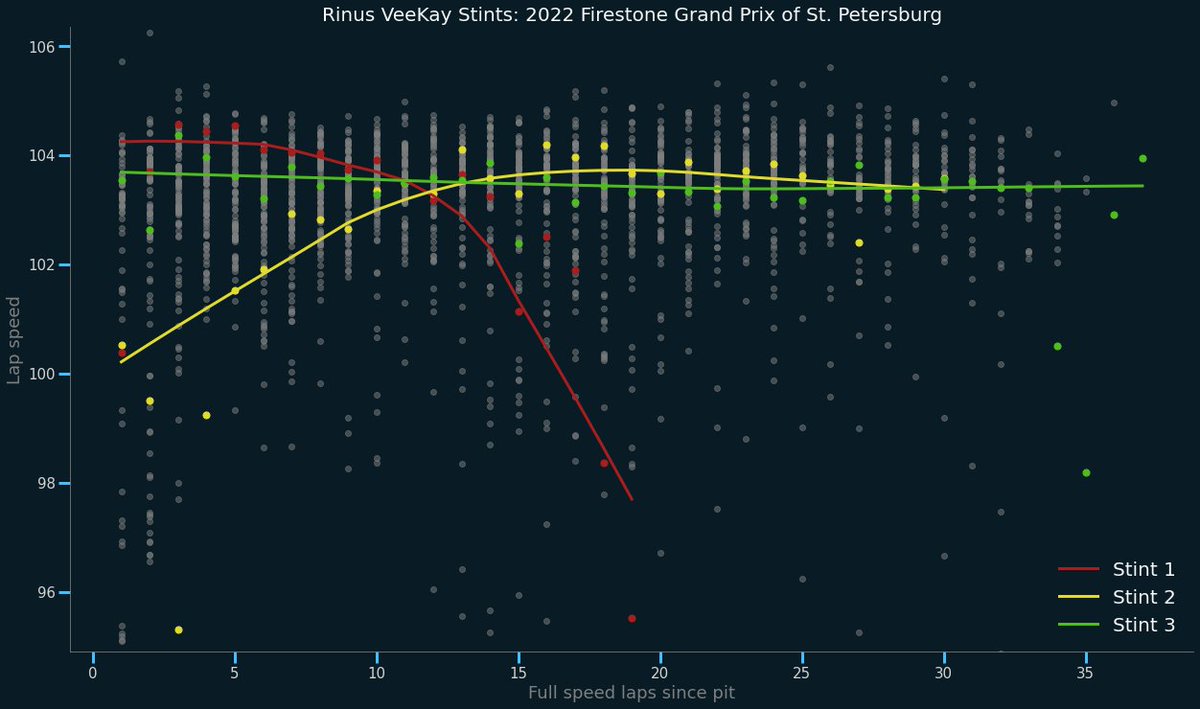
Another theme of yesterday's #FirestoneGP was a drop-off in pace due to tire degradation, particularly with respect to red tires. It was a problem for some more than others: compare @smclaughlin93 to @rinusveekay, whose first stints were both on reds. #INDYCAR
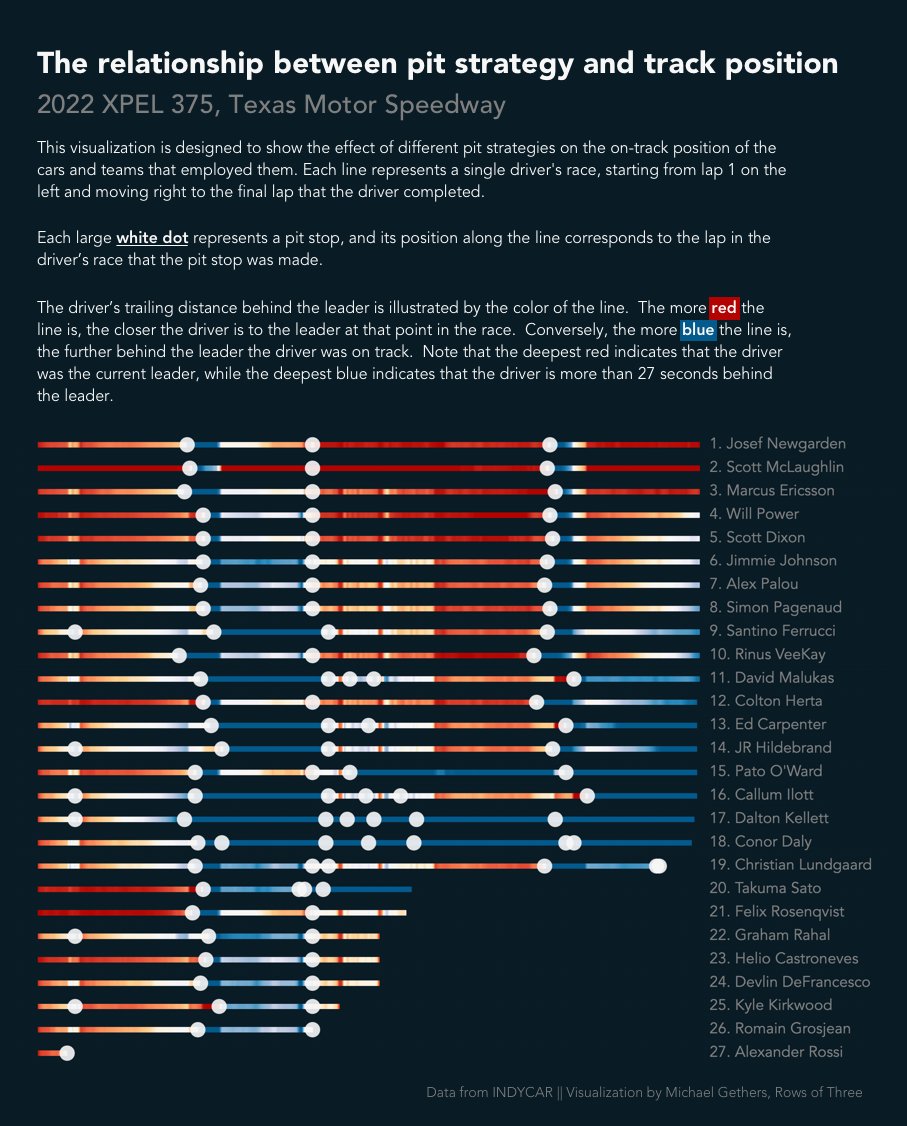
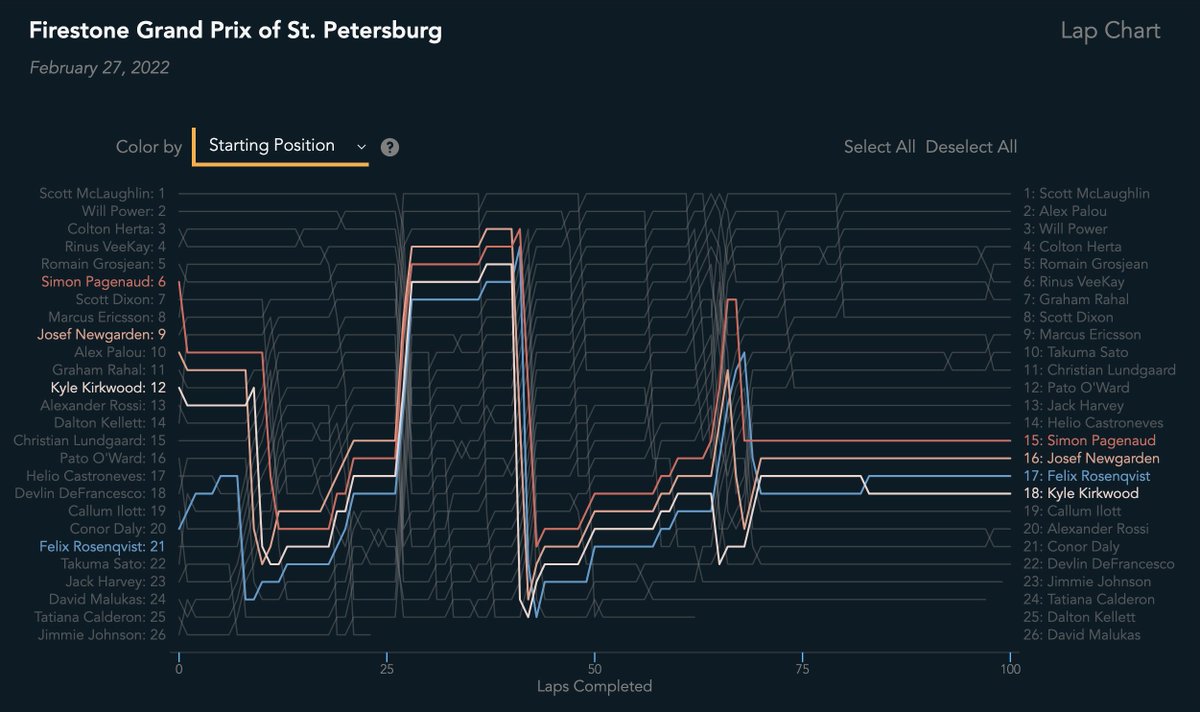
Further underscoring the uncontroversial hypothesis that "strategy matters", take a look at these 4. They started in different places but used a similar 3-stop strategy with an early 1st stop to switch to blacks. They drove the rest of the race together, finishing 15-18. #INDYCAR
@spotstandblog I'll be back with more, don't worry! Life has just gotten in the way a bit the past month or so, but I'll be back at it when things settle down a bit (hopefully sooner than later)