I've been a little quiet here lately, but I haven't been idle.
One of the assignments from my Supply Chain Analytics bootcamp was to clean an Order Fulfillment dataset using Excel, applying the concepts we'd just learned.
🧵👇
That experience reminded me that data cleaning is rarely the glamorous part of analytics, but it's one of the most important. Reliable analysis starts with reliable data.
Most people think dashboard design starts with charts.
It doesn't.
It starts with decisions.
Before I open Power BI, Excel, or Tableau, I first sketch a dashboard wireframe. It helps me answer one important question:
"What decision should this dashboard help someone make?"
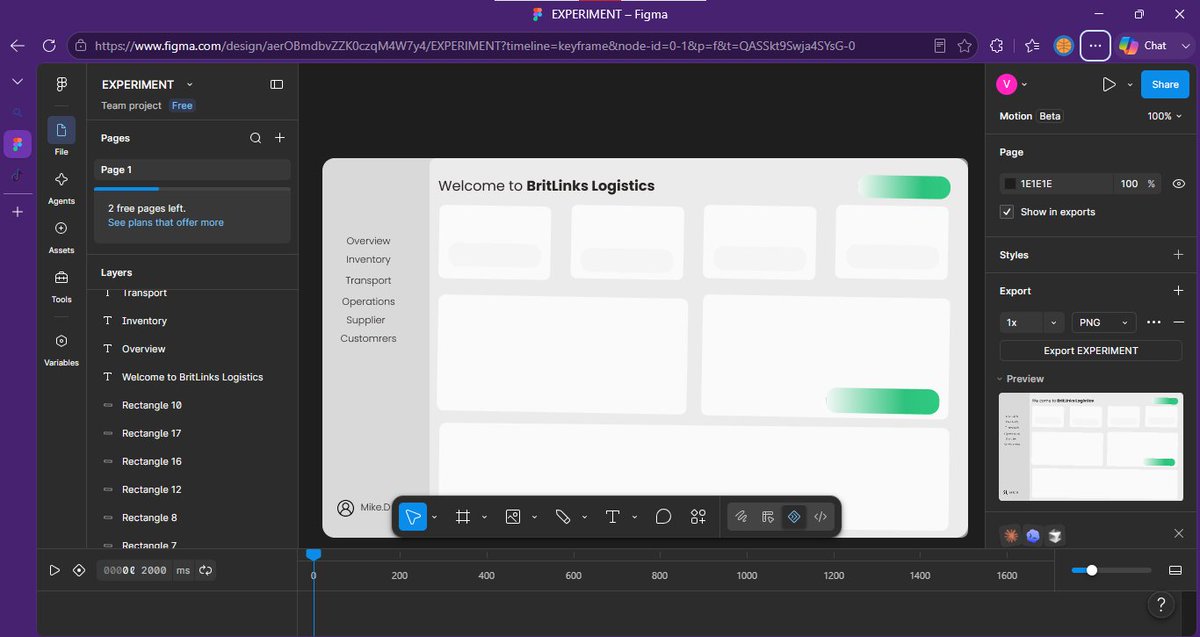
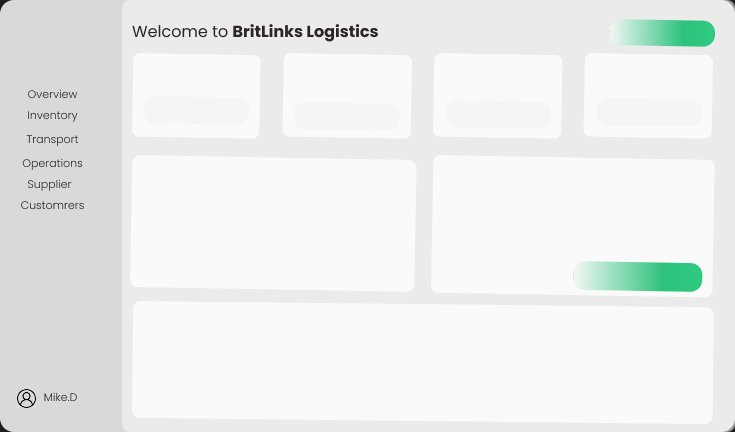
The dashboard in this design is a simple wireframe for a logistics analytics solution. There are no charts yet. No KPIs. No colors competing for attention.
Just structure.
Every section has a purpose. Every space is intentional.
That is the difference between building dashboards that look beautiful and building dashboards that drive business decisions.
A good dashboard wireframe helps you:
• Prioritize the KPIs that matter most
• Create a logical information flow
• Reduce stakeholder revisions before development begins
• Improve user experience and navigation
• Align business objectives with data visualization
• Save development time in Power BI, Excel, or Tableau
As Supply Chain Consultants and Data Analysts, our responsibility is not just to visualize data.
It is to communicate insights that improve inventory planning, transportation performance, supplier management, warehouse operations, and executive decision making.
The best dashboards are rarely the most complicated.
They are the easiest to understand.
Before you build your next dashboard, spend 20 minutes wireframing it.
It might save you 20 hours of redesign later.
Have you ever designed a dashboard that looked great but failed to answer the business question?
Share your experience in the comments. Let's learn from each other.
#DataAnalytics #SupplyChainAnalytics
One takeaway from the session:
Sometimes, improving isn't about learning something new. It's about strengthening the basics so you can solve more complex problems with confidence.
#SupplyChain#SupplyChainAnalytics
Finally, we got to the practical side of the Supply Chain Analytics bootcamp.
Yesterday's session reminded me that before you can analyze supply chain data, you first need to trust it. 🧵👇
POV: You're mid scroll on a Sunday night when three messages land in your inbox, back to back, and you can't stop rereading them.
Let me set the scene.
Five weeks ago, "Cohort 2" of the Excel & AI for Supply Chain Analytics Bootcamp was just a curriculum outline on my laptop. Last week, it became real people: logging in, opening spreadsheets, staring down concepts they'd never touched before.
Week 1 wasn't about dashboards. It wasn't about dazzling AI prompts. It was about something slower and harder: building the foundation before the fireworks.
I could feel some of them wanting to rush ahead. To skip to the "cool part." I didn't let them. And by Sunday night, this is what showed up in the group chat:
Michael wrote:
"I like the fact that you're not rushing into practicals, but making sure we truly understand what supply chain analytics is all about."
Phil wrote:
"You blend real-life scenarios and case studies into every lesson, connecting everyday events to supply chain concepts. There is just so much to learn!"
Raphael wrote:
"Thank you, sir, the class was very impactful."
Three different people. Three different ways of saying the same thing: understanding first, tools second.
That's the whole philosophy behind everything we build at DataChain Analytics. Excel is a tool. AI is a tool. Power BI is a tool. But a tool in the hands of someone who doesn't understand the problem is just noise dressed up as a dashboard.
Give that same tool to someone who understands the supply chain: the ports, the delays, the inventory that sits in a warehouse costing money every single day it's not moving, and suddenly you're not building charts. You're building decisions.
That's Week 1. Four more weeks to go. And I already know Cohort 2 is going to surprise me.
Now, to everyone reading this:
→ Founders building the supply chains behind your products.
→ CEOs trying to turn operational chaos into visibility.
→ Supply chain professionals who've felt the 2am stress of a stockout no one saw coming.
→ Managers translating strategy into the daily grind of execution.
→ Analysts who know the answer is in the data, if only the data would behave.
Welcome to August.
Not the "new month, new me" kind of welcome. The kind where you actually look at the back half of the year and ask: what did I say I'd fix, and have I fixed it?
Whatever that is for you, a reporting process that still lives in someone's head, a forecast that's really just a guess with a formula around it, a team that needs to see data instead of hear opinions, August is long enough to make real progress on it, and short enough that you can't afford to waste it.
Here's to a month where understanding comes before the dashboard, insight comes before the tool, and impact comes before the applause.
Welcome to August. Let's build.
#SupplyChainAnalytics #DataAnalytics #BusinessIntelligence #PowerBI #Excel #AI #DataChainAnalytics #WelcomeToAugust #SupplyChainManagement #DataDrivenDecisions
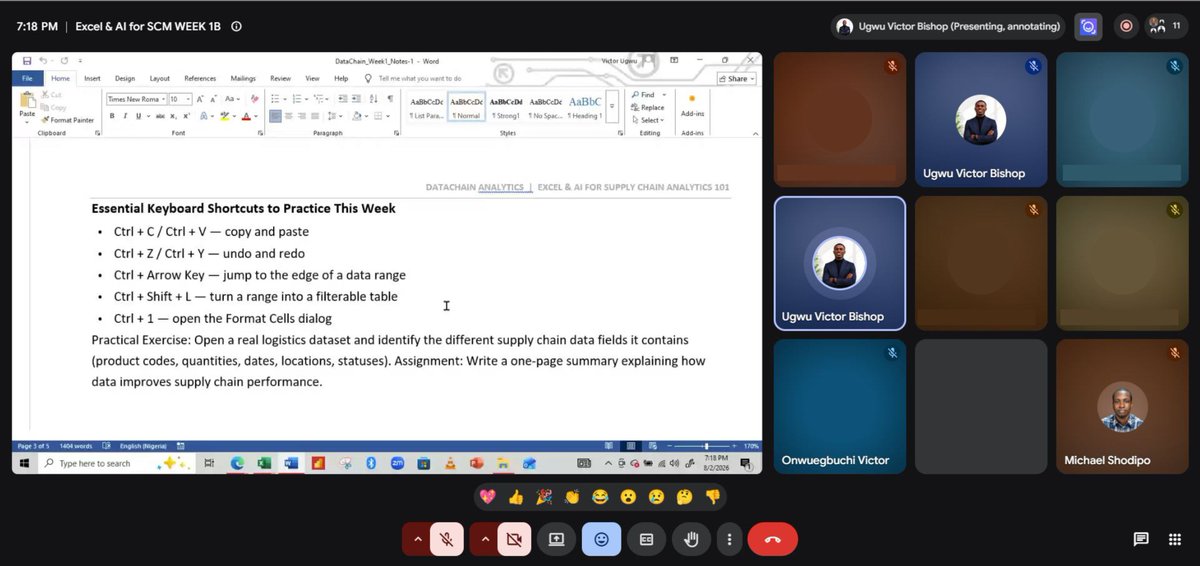
Yesterday was my first full session of the Supply Chain Analytics bootcamp with @_VictorUgwu , after an introductory session last week.
A few things challenged how I think about analytics...🧵👇
My biggest takeaway is that analytics isn't just about dashboards, SQL, or AI.
It starts with observation, asking better questions, and connecting the dots before choosing the right tool.
Looking forward to the practical sessions.
#SupplyChain#SupplyChainAnalytics
Ironically, I'd watched Game of Thrones without ever noticing those patterns😅.
It made me realize that observation is a skill, and analytics begins long before you open Excel or SQL.