@PradeepBonde highlighted a crucial distinction between two types of stock movements, providing valuable insights to laser-focus your own stock selection, even within a breakout strategy. I personally categorize one as a range-expansive momentum move (e.g., $COIN on 20/11), while the other is identified as a trend-following move (illustrated well by $VRT).
Consider the following principles that I adhere to when concentrating on momentum-based trading, with a focus on short-term range expansion via executing trades that are trading at high relative volume beyond pivotal levels.
1. Direct your attention to stocks in these five sectors: $XLK, $XLY, $XLI, $XLE, $XLV. They have the highest success rate of breakouts. I wrote about this with reference to @florinlazar001 research 1-2 years ago.
2. Give preference to lower-priced, lower float, lower capitalization stocks, and those with high short interest, as they often undergo substantial magnitude moves.
3. Steer clear of executing short-duration setups that surpass 4x ATR multiples from their 50-MA. The only exception to this rule is for stocks with a market cap below $500 million, where I would still set not trade them at more than a 5x multiple.
4. Setups should encompass range compression coupled with volume contraction, likened to a compressed coil spring.
5. Execute trades only on setups securing pivotal levels below 100% ATR from the current Low of the Day (LoD). This significantly heightens the probability of concluding the day with unrealized profits based on historical IV, implied volatility.
6. Execute trades that secure pivotal levels with substantial volume relative to its average 50-MA volume, contingent on the time period of the day (e.g., 40% relative vol to 50-MA vol in the first 30 minutes is a substantial liquidity event). If you have a watchlist stock trading beyond 10% dollar volume to their market cap, they should be your priority (look at how $CVNA started the +600% run in 2023)
7. Refrain from entering if stop losses require pricing and sizing beyond 1 ATR from your entry. This ensures optimal exploitation of a winning trade in terms of profit factor and risk-reward ratio.
8. If your thesis isn't validated upon entry, reduce your position size before it even reaching your stop. If you are not proven right, you are yet to be proven wrong either. By controlling and improving losses below 1.0R, 0.8R, and 0.6R per losing trade, you can go a long way. Imagine the capability of a 5R winner covering 9 losses, instead of 5.
9. Don't dismiss leveraged ETFs as trading ideas; they can exhibit much larger range-expansive moves than individual stocks within the same sector or group. Now I'm stalking etfs like $KOLD $DRIP $TZA $DPST
I genuinely believe that these rules hold merit and can enhance your profitability.
Focusing on Relative Strength (RS) is the closest thing to having an unfair advantage in momentum trading. It strips away market noise and forces you to align your capital strictly with institutional urgency.
When you prioritize names with elite RS (90–99 ratings), you are shifting your trading from a game of predictive guessing to a game of structural probability. Here is exactly why elite traders make it the bedrock of their selection process:
1. It Reveals True Institutional Footprints
Retail traders buy stories; institutions buy blocks. Because large institutions (mutual funds, hedge funds, pensions) manage billions of dollars, they cannot enter a position all at once without pushing the price up.
When the broader market ($SPY or $QQQ) is sliding lower, but a specific stock refuses to drop and instead grinds sideways in a tight flag, that is the physical footprint of institutional accumulation.
They are actively stepping in and absorbing every single share of retail panic-selling. The supply is locked up.
2. The "Springboard Effect" (First to Launch)
Stocks with elite RS act like beachballs being held underwater. The market's downward pressure is the only thing keeping them down.
The moment the broader market puts in a minor bottom or a sharp intraday bounce, the downward pressure is released. Because these stocks have zero overhead supply, they don't just bounce—they explode into blue-sky breakouts. By focusing on RS, you ensure you are holding the primary leaders of the next market leg, rather than laggards that are struggling just to reclaim their moving averages.
3. It Drastically Lowers Your Risk
It sounds counterintuitive to buy stocks trading near all-time highs, but mathematically, elite RS provides incredibly clean risk definition:
Market ($SPY): \________/ (Deep, sloppy correction
Elite RS Stock: ---[Flag]--- 🚀 (Tight defense at the 8-week EMA / 21-day EMA)
Because an RS leader holds a tight, orderly structural pattern (like a High Tight Flag or a short-term "squat" into dynamic support) while the market drops, your point of invalidation is clear as day. You can place a stop right at the bottom of that tight consolidation. If the market turns up and the stock triggers your buy stop, your risk distance is tiny, making a 1:5 risk-to-reward ratio highly achievable on the subsequent expansion.
4. It Prevents You from Buying "Cheap" Traps
Traders who don't watch RS constantly fall into the trap of buying stocks that look "cheap" because they've pulled back 30%–40%. In a momentum environment, weakness begets weakness. A stock that breaks down further than the market is showing a complete absence of institutional support. Focusing on RS guarantees your capital is always concentrated in the market's strongest, most resilient vehicles.
🐝Stockbee Scans In FINVIZ
🐝SCAN #1 - 20% Weekly Winners
Firstly, the video from the Legend @PradeepBonde is here - better to learn it from the man himself than from my interpretation.
https://t.co/eBXoRHIcR1
The criteria shown in the video at (pic 1) is:
Price change in 1 week (5 trading days) >=20%
Volume >= 100,000 shares
Price >= $5
I believe you can only filter by price in Finviz Elite, so the Elite URL (pic2) would be:
https://t.co/T4skgVkMjH
Without the Elite subscription, you can still find the stocks (pic3) but you cannot filter by price (however you can sort by price)
https://t.co/mizugY2QmE
🐝SCAN #2 - 9 Million Movers
Pradeep kindly reposted my FINVIZ "Stockbee 9 Million Mover" scan on his X, so hopefully that is a good starting point for that scan. Link is below:
https://t.co/d57XAI1wn4
There is also a TradingView version here:
https://t.co/1RtklrWmMw
Closing Comments:
TC2000 permits custom formulas in it's scans where as Finviz presently does not. TradingView has "pinescreener" but currently that is limited to a maximum of 1000 stocks in a watchlist and it will only process 40 stocks before stopping.
Some of Pradeep's excellent work may be possible in FINVIZ and TradingView while scans using more complex formulas would require exporting the data and using Excel, Python etc. to replicate the TC2000 components ... or use TC2000 like Pradeep.
Best of luck 🍀
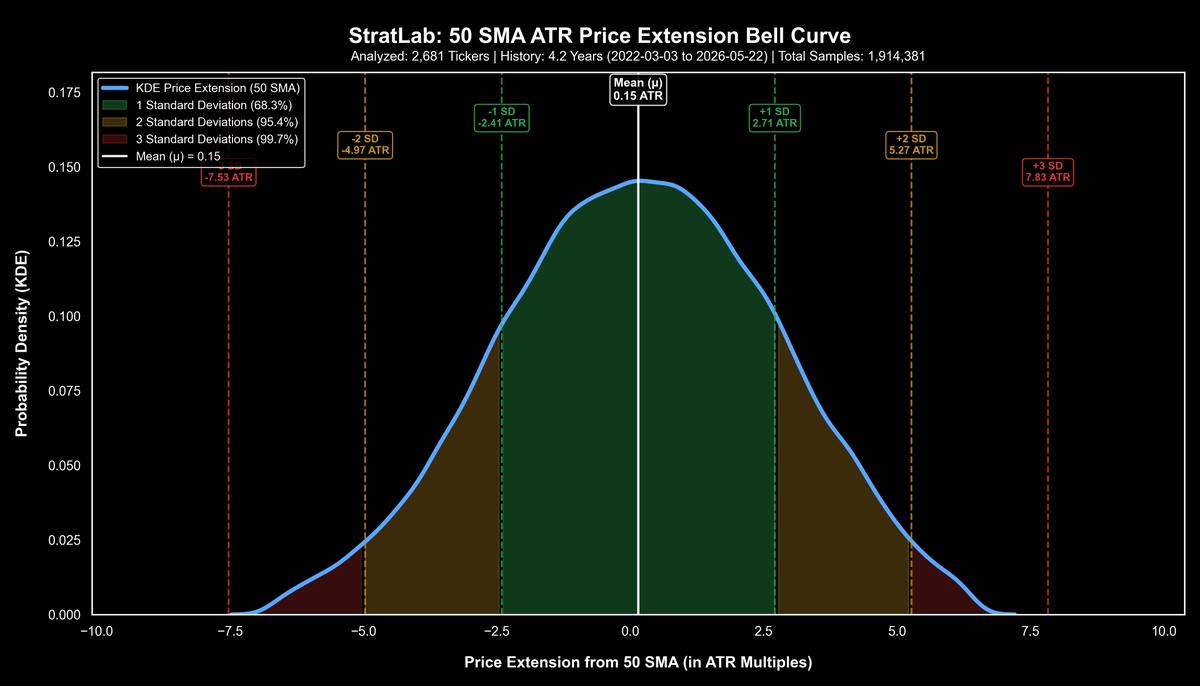
🧵 THREAD: ATR Extension - From Heuristic to Empirical P
1/ Backtested @jfsrev 8x ATR heuristic for the 50 SMA across ~2,700 tickers with nearly 5 years of data.
The result? It's not just a rule of thumb. It's statistically correct.
Here's what the data says 👇
Every day, try to develop greater clarity about setups. process, entries, exits, stops, sizing, timeframes, and catalysts.
The more you reorganize the knowledge and spend time understanding the setup, the easier it will be to implement.
This requires real dedication to repeatedly revisit a setup, reclarify, and reset your mind.
When you immerse yourself in this, one day it clicks, and then suddenly everything starts working.
Through more reflection and revisiting the same idea, the idea becomes part of you.
And whenever we engage in such purposeful mind-clarity efforts in any field, it always results in significant money.
Depth creates wealth.
Surviving fifty years of futures trading
I did not realize it in the beginning, but in hindsight now understand that it takes three to five years to get a scent on how to become profitable without wiping out an account
Of the 80 or so professional traders Jack Schwager @jackschwager has interviewed for his Market Wizards series (and these are the best of the best), fewer than a handful became profitable from the start. Most took three to five years to start gaining traction
So what is the lesson?
Unless you have money to keep funding new accounts, you better learn to take quick losses.
My average loss in 2025 was less than 2/10th of 1% of my total nominal capital.
I asked in an early X post today how much followers risked in each trade.
My initial risk per trade is 7/10th of 1% and I try to move to breakeven with a few days.
If you risk more than 1% of your capital per trade as a beginner, I would be shocked if you did not wipe out your account.
Be obsessive about taking quick and small losses otherwise.
If you are someone who risks any more than 1% of your capital per trade my only hope is that you trade the same markets as do I. Professional traders are always hoping for fresh meat.
THINGS THAT QUIETLY DESTROY MOST TRADERS:
1. Romanticizing trading while refusing to respect how brutal it actually is.
2. Thinking intelligence automatically makes you a good trader.
3. Expecting peace from a profession built on uncertainty.
4. Being “passionate” about trading means nothing if you can’t handle repetition and uncertainty.
5. Looking for motivation instead of emotional stability.
6. Most traders are not emotionally stable enough for this profession.
7. Some people never become profitable because deep down chaos feels more familiar than discipline.
8. Mistaking stimulation for passion. A lot of traders are addicted to chaos, not trading.
9. Taking every drawdown as a personal attack on your intelligence.
10. Watching profitable traders for motivation while refusing to copy their boring discipline.
#Earnings have been announced. How to get to the data quickly?? Check out this short video on how to access the Press Release, Conference Call recording and analysts responses in a few clicks on #thinkorswim.
@SchwabTrading
My Dan Zanger deep dive is available for free, based on only free materials.
Several people DMed me, offering access to Dan’s old newsletters, but I declined. Copyright issues aside, I really wanted to prove just how much you can learn from what’s freely available online.
Individual sources are all linked in my write-up (https://t.co/UVtcDAVmsx), but for convenience, here’s a list of the key resources I used.
Dan’s own website, containing various written interviews (2000–2010)
https://t.co/upm796AY8D
Written interview with the CMT Association (2009)
https://t.co/M2mwPjqmLa
Probably Dan’s best interview, and certainly the highest WWR one (2005)
Part 1: https://t.co/Hy6DKfc7YT
Part 2: https://t.co/ZKgj9VAcQb
Very good longer spoken interview from 2016
https://t.co/f1IEFaJuaV
More recent spoken interviews on Spotify (2018 & 2020)
2018: https://t.co/6TLSONMl56
2020: https://t.co/YofXQWEQ2B
A few live broadcasts Dan did, with this being the most interesting IMO (because you can feel just how much he’d improved at environmental awareness/trading less; from 2015)
https://t.co/DDbZH5ZySM
The ‘catch’ is that going through this stuff takes a LOT of time and effort. But that’s also a good thing. The *intentionality* this type of exercise requires is what makes a study method effective.
Plus, an edge, by definition, involves doing things of value others can’t or won’t do. And when it comes to information in the public domain, the edge must come from what you do with it.
As Dan said: you can lead someone to water, but you can’t make them drink.
If your goal is to optimize for account growth speed, you need to trade the fastest stocks that still fit your account’s liquidity profile. In other words, what is the lowest dollar-volume stock you can trade without materially moving the price when you enter or exit?
Below is a breakdown of scan filters and the number of stocks each filter returns:
$vol > 30,000,000 and APTR(14) > 5 = 471 stocks
$vol > 100,000,000 and APTR(14) > 5 = 217 stocks
$vol > 250,000,000 and APTR(14) > 5 = 217 stocks
$vol > 500,000,000 and APTR(14) > 5 = 117 stocks
$vol > 1,000,000,000 and APTR(14) > 5 = 36 stocks
The takeaway is simple: as your account grows and your required liquidity threshold increases, your opportunity set shrinks. You get fewer names that are both fast enough and liquid enough to trade cleanly.
O’Neil’s Chart‑Reading in
- Price + Volume = Truth. Everything else is noise.
- Accumulation shows up as up‑days on big volume.
- Distribution shows up as down‑days on big volume.
- Tight price action = strong institutional control.
- Loose, wide swings = weak sponsorship.
- Breakouts must happen on explosive volume.
- Pullbacks must happen on light volume.
- RS line should hit new highs before price.
- Bases must be smooth, controlled, and not too deep.
- Handles must drift down on quiet volume.
- Break of the 50‑day on heavy volume = sell.
- Multiple distribution days = market under pressure.
99% of options traders are gambling because they never learned the fundamentals.
This 1-hour Yale lecture changes everything.
In just 60 minutes, you’ll learn more about options trading than most overpriced trading courses ever teach.
No hype. No fake gurus. Just real knowledge.
Save this and watch it without distractions. 📌
In 1994, legendary investor Peter Lynch delivered a powerful 1-hour masterclass on stock picking
.He broke down real winners he identified early:• Taco Bell — 42× return
• Ford Motor Company — 10× return
• Dunkin' — 7× return
Step by step, he shows how to spot opportunities hiding in plain sight—before the market catches on.
No time now? Save it.
This is the kind of edge you revisit.